Market Health Measures: This link provides a look at the yield curve chart. Watch for it to invert, and look at the inverted/flat curve that preceded the 2000 and 2008 crashes. Here's another link that monitors the Conference Board's Leading Economic Indicators (LEI) , our most accurate forecast of economic health. Notice below how each recession (the gray bars) was preceded by a downturn in the LEI. Read Forbe's Ken Fischer's take on this measure here. Finally, take a look at change in corporate profits.
Here's another important article by Steve Reitmeister of Zacks.
Hedging with a
Portfolio using Inverse ETFs (Find article here)
10/26/12 .... Eliminating Long-Stock Risk with Protective Puts
(the Married Put) ...This
is about
buying a put in addition to stock as a vehicle to reducing/even eliminating
the downside risk.
- Find article here
and trade examples.
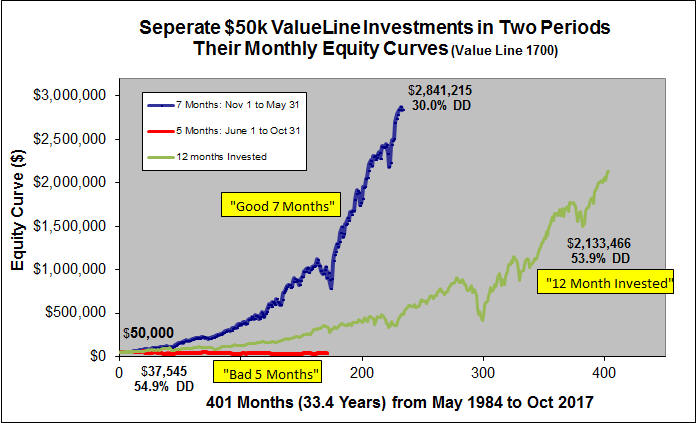
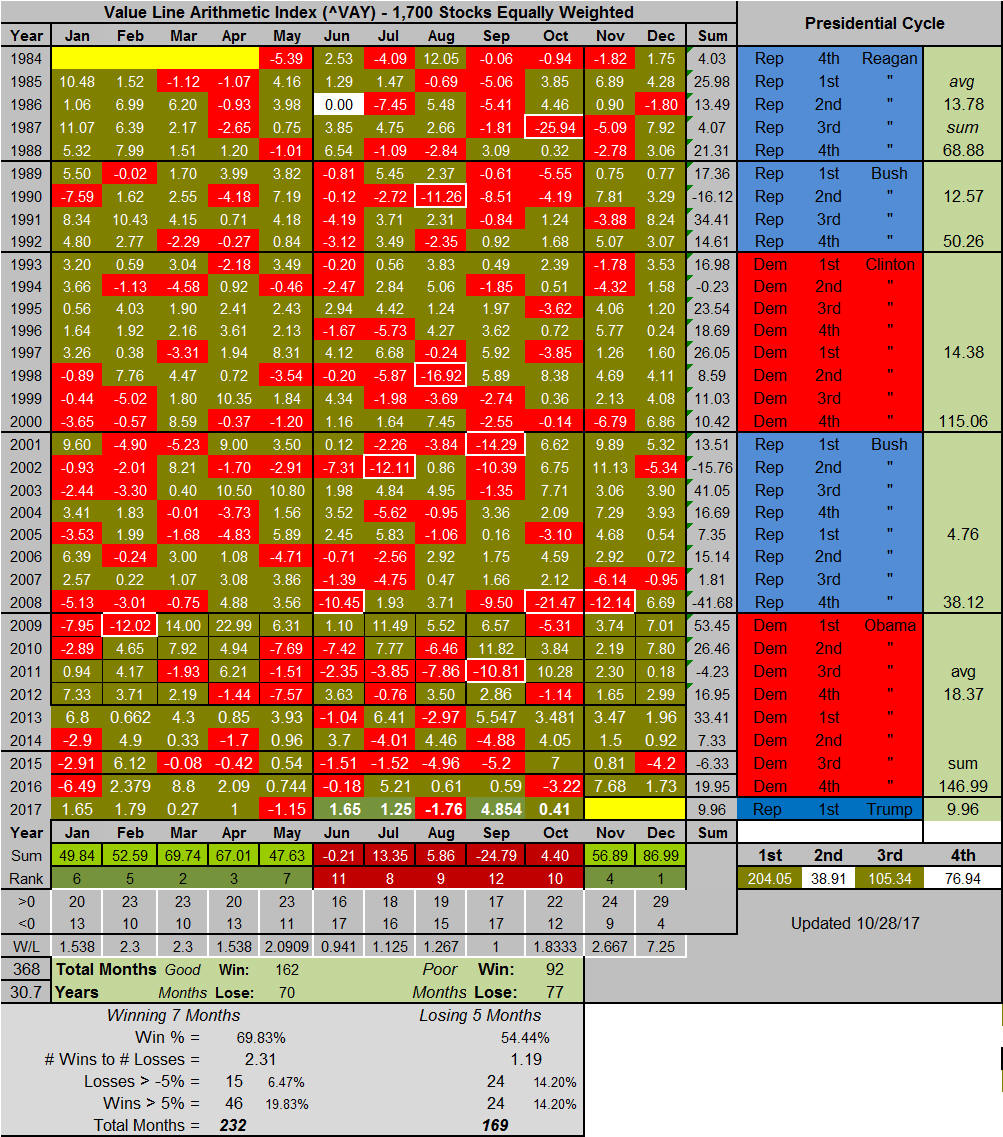
05/16/17...Monthly Analysis of Value Line 1700...This first table shows the monthly performance of the equally-weighted, Value Line Arithmetic Index since May 1984. Unlike similar treatments that track the Dow or the S&P - both large cap indexes – the Value Line Index is unweighted by company size and consists of a wide range of company sizes (1700 stocks in all). This index also reflects more what TripleScreen is actually trading. Several points are obvious in this data: 1. The top 7 months of the year, based on performance, were Nov through May; the contrast is remarkable: $50k invested in the good 7 months grew to $2,874.269 in these 33 years, while $50k invested in the bad 5 months fell to $35,270. 2. December has been a winning month in 29 of these 33 years; next best has been November at 24 and 9 (clearly December is a special month for the market). 3. There were 2.29 as many winning versus losing months in the good 7 month period and only 1.16 as many in the bad 5 months (clearly, the bad 5 months puts the market winds in your face). 4. There also were three times as many months returning more than 5% than losing more than 5% (46 and 15) - and nearly twice as many high performing months; whereas, that ratio was equal in the bad period (24 and 24). 5. Worst month to be in the market was September - it and June were the only months to have an overall losing sum for these 33 years. 6. October was the only month to have losses greater than 20%, and it had two (1987 and 2008). 7. Over this period, the market has performed better under democratic administrations (Obama averaged 18.4%, Clinton 14.4%, Reagan 13.8%(only a portion of his two terms), Bush elder 12.6% and Bush younger 4.8%). 8. The 1st year has been the best in the Presidential cycle, averaging 199%, while the 2nd year has been the worst at 39%. Based on this data, I have always felt that I was better off shifting my 401k funds into bonds during the 5 month period. Though the 5-month period is difficult, the impact on short-term trading is less severe than just holding over a longer term.
The compounded annual growth rates (CAGR) are as follows: 7 month invested (13.1%), 5 month invested (-1.1%), 12 month invested (11.9%). What's even more important is that the 7-month investment strategy would have experienced a 30% max draw down during this period; the 12 month strategy a 53.9% draw down; and the 5 month strategy a 54.9% draw down. Obviously, on all accounts, we're better off being in the market long term on a 7 months a year basis. Also, you eliminate the market risk entirely for the 5 most dangerous months of the year. Too, I want to emphasize that short-term trading, though not immune, does not suffer as badly during the down 5 months each year because TSM's emphasis continues to be trading quality stocks (those with upwards earnings revisions), in strong industries (top quarter of 265 industries), that are pulling back to established areas of support. In 2008 the S&P experienced a 38.5% draw down, while TSM made 450 half position trades (329 or 76.6% winning trades) and returned 111%. Let's say that you have a diversified portfolio, say worth $1 million and you want to protect it during the bad five months of the year (say from a 5% pullback, which would cost you $50k). You're in a taxable account so you cannot change your portfolio mix (say go to bonds) without incurring a tax on your gains, which may be substantial this year. What do you do? This second chart breaks down these good/bad period returns of Value Line by year. What it shows is what staying out of the bad five months does for you is to avoid the risk of the large fall, which have all occurred during those months. Most years though the bad five months just had a smaller return.
Note, I don't make every one of these trades myself, though I do make many. Trade results are hypothetical. Think of TSM results as
what's possible from these forecasts. Note, it's highly unlikely that you (or I) will consistently match these results (because one would
have to be sitting in front of a computer screen all day long while the market's open). Having said that, I do actively trade TSM
screened and forecasted stocks for my own accounts (TradeStation).
Links of Interest Company Profile | MSN Stock Ranking |
Schaeffer Research | IBD Stock Check Up
|
Daily Point & Figure Chart |
Other Key Statistics | Zacks Fundamentals
Stock Picks for Tomorrow See Article supporting use of 8-period moving average for entry. I use this to enter when a stock is falling at the open.
 ***********
TSM Put candidates are supplied each evening and show the trade that could have been made at that day's closing, but barring a significant overnight occurrence, these Put trades should still be available the next morning. The following chart shows the relationship between initial % Downside protection and days to expiration when the Short Put trades were executed. From 2011 through 2013 (to 7/16/13) 117 trades were made (17 losses) for about $41,000 in profit with average annualized return of 16.6%. Below, the green points are winners (size of bubble related to size of win), while the white points were losers. The following points can be made:: All losses were either trades made with longer than 25 days to expiration or falling below the red regression line; using the equation in the chart, with 10 days to expiration, I need at least 10.6% {(0.0044(10) + 0.0619)x100} downside protection--for 20 days, I need 15% and for 25 days, 17%;
Potential Written Puts for 11/24/17
Note, these are available Puts for TSM stocks, not necessarily ones that I
recommend
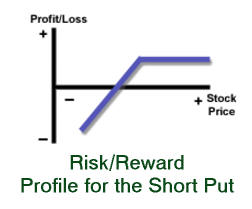
Naked Put Strategy:
Articles about Selling Puts:
The MPS marries a long TSM stock position with a long in-the-money Put. It's goal is to generate income and capital in a risk free way. It's a simple concept, probably best seen by an example. See the MGA trade details in the above link.
 | |||||||||||||||||||||||||||||||||||||||||||||||||||||||||||||||||||||||||||||||||||||||||||||||||||||||||||||||||||||||||||||||||||||||||||||||||||||||||||||||||||||||||||||||||||||||||||||||||||||||||||||||||||||||||||||||||||||||||||||||||||||||||||||||||||||||||||||||||||||||||||||||||||||||||||||||||||||||||