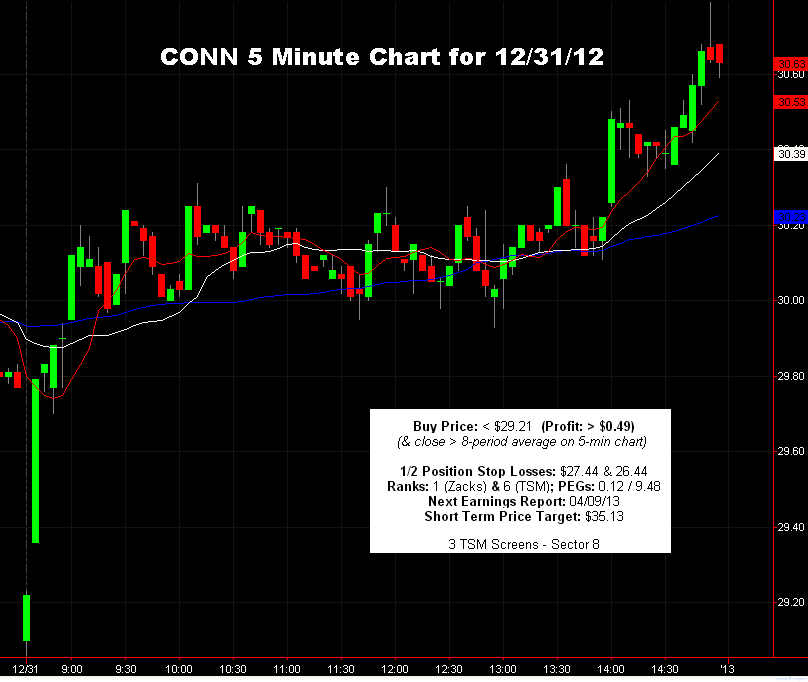
In these uncertain times, the market (and
individual stocks) often open higher then spend much of the day falling;
therefore, if I can watch the market, I place an additional requirement on
my entry: It has to fall below my entry point and close above the
8-period moving average on a 5-minute chart.
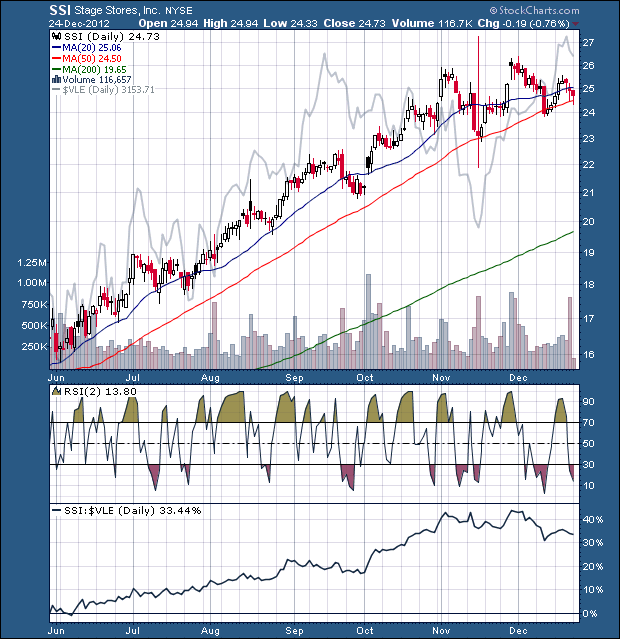
For example, the 12/26/12 TSM Daily
Report recommended buying SSI below a $24.56 price. Here's the chart
that I used to make that recommendation. On the day before Christmas,
it had fallen to the support of its 50-day moving average and reversed to
make a bullish bottoming tail. I recommended a buy on the next session
below $24.56 and actually bought at $24.06 (and then sold on 12/31/12 at
$24.81 for a $0.75 gain.
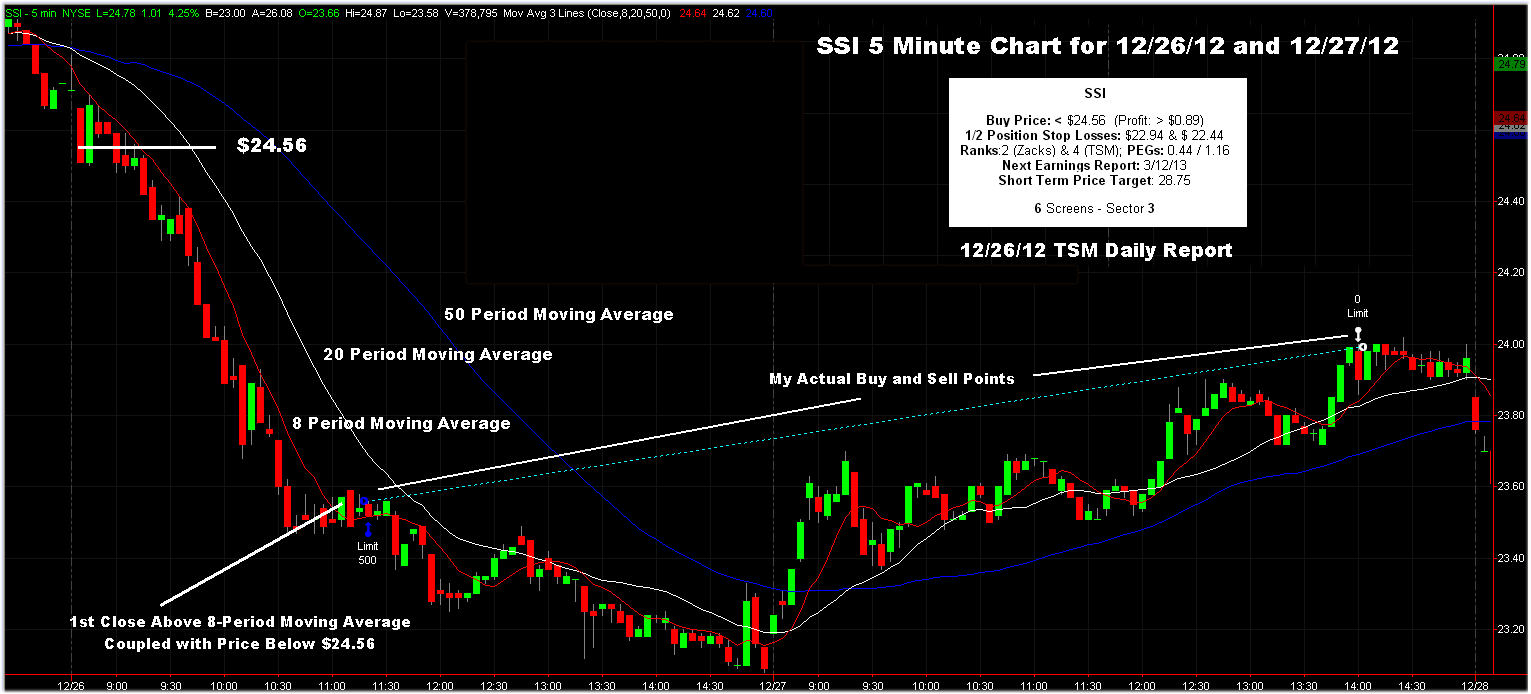
In actuality, I used the 8-point moving average to enter at $23.56 then closed the position at $24 and half at $24.81. The following chart shows the entry following a close above its 8-period moving average. When this entry is used,
often no entry can be made even though price falls below the TSM entry
point. That is exactly what happened with the CONN forecast in the
12/31/12 TSM Report.
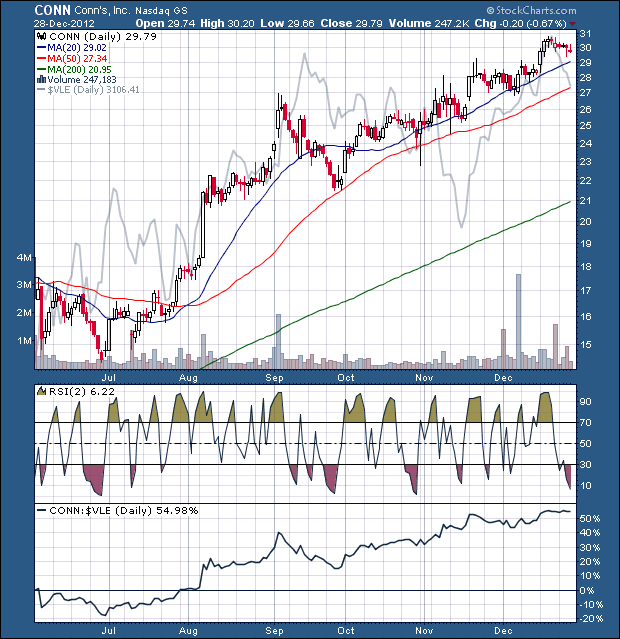
The following chart was used to develop
the CONN forecast. I particularly liked the support at the 20-day moving
average. Over the first 5 minutes of trading on 12/31/12, however, CONN
traded below TSM's $29.21 entry point, but over the entire day, its price
did not close above its 8-period moving average while the price fell below
the entry point. The combination of entry point and a closure above
its 8-period moving average was not met so the trade was not entered.