|
I want to demonstrate the power of the 2-period RSI
used as buy and sell triggers. For the life of me, I cannot see any reason
to use any other indicators. As I've said, this metric is a proven oversold/
overbought indicator, one that's been validated over millions of trades. Let
me show how it can be used.
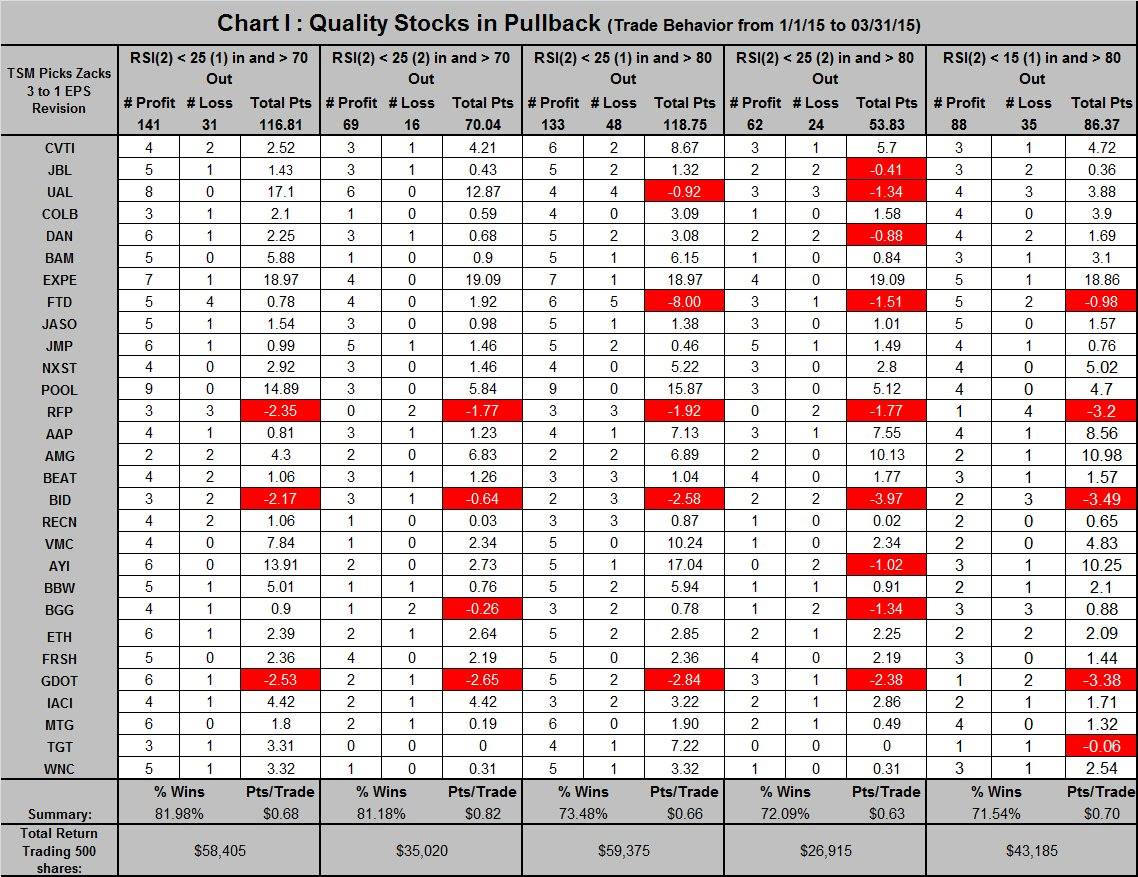
My population for this study consists of 29 TSM stocks (those holding
membership in at least 1 of 49 fundamentals driven screens) that in Jan had
a Zacks ranking improvement from a 3 the week before to a 1 in the current
week. The table documents how these 29 could then be traded from Jan through
March using the 2-period RSI. I trade this list of stocks for 3 months after
they make my list. And I add members to the list every evening.
There are four strategies being evaluated:
1. When one of these 29 became oversold enough to lower its RSI(2) below 25,
the stock was bought at the next day's open. That position was then held
until either that stock became overbought to the extent its RSI(2) exceeded
70, in which case it was sold at the next day's open, or it was sold at the
open of the eighth day regardless of what the RSI(2) is. This strategy
produced a 141/31 win/loss record (81.98% win rate) and $116.81 points;
buying 500 shares of each position would have produced $58,405.
2. This strategy required two closes below a 25 RSI(2) before the position
was entered at the next day's open. It exited each trade under the same
conditions as strategy 1 and produced a 69/16 win/loss record (81.18% wins)
with $70.04 points for a total of $35,020 -- lower than strategy one buy
with many fewer trades.
3. and 4. were similar to 1 and 2 but used a higher exit RSI(2). It had a
significantly lower win rate but produced more cash.
5. The last strategy required a lower entry RSI(2) and the higher exit
RSI(2).
I would combine strategies 1 and 2. When a TSM (3-1) stock closes the day
with a RSI(2) below 25, I would buy the position ($25k) at the next day's
open. If that day the stock closed with another RSI(2) below 25, I add
another $25k to the position. I would then close the entire position at the
next day's open following a RSI(2) 70 close or on the 8th day's opening
following the last entry.
I will begin providing this list on the TSM page in January.
|