 |
The
Triple Screen Method "Explained"- Just $24.95
(includes shipping) - 2nd Edition Published
12/30/05
Learn About...
-
Weeks of data that validate the TSM
approach (2003 to 2005)
-
Buying stocks on pullbacks
-
Candlestick patterns: A
reflection of market psychology
-
What drives price change
-
An analysis of the profit opportunities
offered by buying TSM stock price pullbacks
-
How Fibonacci numbers suggest areas
ripe for pullback and reversal
-
Risk Control or the science of money
management
-
Cycles in the Market
-
The Intra-Day, Six-Month, The
Presidential, The 10-Year Cycle
-
Three
Measures of market health
-
Quad
analysis: a measure of sector strength
-
"Synthetic" covered calls
|
Spiral Bound Hard Copy (2nd Edition) - $21.73 Plus Shipping
or PDF file - $5.00
Link to Publisher and 10-Page Preview Here
The Triple
Screen Method Book
2nd Edition (12/30/05)
An Investment
Program Utilizing Both Fundamentals and Technicals
by
Richard W. Miller,
Ph.D.
Worden TC2000’s “Sir Techno-fundamentalist”
- Table of Contents & Excerpt
-
Part I: The TSM Approach
Earnings Fundamentals – Screen One
Zacks Rankings – Screen Two
PEG Ratios: Are Any of the Candidates Overpriced? – Screen Three
Using the Weekly Triple
Screen Picks Small
Account Folio Investing
Historical Examples: Triple Screen Approach Over a Longer Term
Part II: Methods
Section 1: Buying the Pullback
Candlestick Patterns: A
Reflection of Market Psychology
What Drives Price Change
An Analysis of the Profit
Opportunities Offered by Buying TSM
Stock
Price Pullbacks
Fibonacci Numbers Suggest Areas Ripe for Pullback and Reversal
Trading Fundamentally Sound Stocks in Pullback
The “Hammer” Candle, a High Probability Reversal Signal
Section 2: Risk Control or the Science of Money ManageTrade
Trade
Trade Management, the Multi-Day Trailing Stop
A TripleScreenMethod.Com Daily Report Example
Section 3: Cycles in the Market
The Intra-Day Cycle
The Six-Month Cycle
The Presidential Cycle
The 10-Year Cycle
Section 4: Market Health Characterizations
NYSE Bullish Percent
Number of Stocks Trading Below Their Respective 200-Day Moving Averages
The “Amazing 200”
The Sentiment Product
Sector Rotation Modeling: a Markov Chain Analysis
Section 6: An Option Approach to Buying TSM Stocks
So What are Options?
The “Synthetic” Covered Call
More Thoughts on the “Synthetic” Covered Call Strategy
- An Excerpt --
Using the Triple Screen List
Ultimately,
price appreciation depends on three fundamental measures of earnings: earnings,
earnings growth, and the stability of both. If earnings historically have gone
up year-over-year, if earnings growth has been steadily increasing, and both
have a good track record, i.e., a history of this performance, price increases
as well as buying pressure increases until (1) price becomes expensive relative
to earnings and their growth rates (PEG values become too high), (2) owners take
profit (increasing selling pressure), (3) short sellers enter the market because
they think the stock’s price is extended (adding to the selling pressure), or
(4) the market as a whole or the particular business sector becomes extended
(again increasing selling pressure). This increased selling pressure, in turn,
leads either to a pullback in price or a congestion of price over a trading
range for a period of time. If both market and sector remain bullish, if the
stock’s fundamentals haven’t changed, and if the PEG ratio remains below 1.75,
one wants to buy the pullback, at likely areas of technical support (e.g.,
moving averages, prior reversal areas, Fibonacci support areas, etc.)
Further Along in the book
Appendix 1: Buying
the Pullback
“The thing that hath been, it is that which shall be
and that which is done, is that which shall be done
and there is no new thing under the sun.”
………Ecclesiastes
You’ve probably
heard or read them: the analysts, economists, and corporate leaders on CNBC or
the print media offering us their opinions concerning the health of the market
or about a particular stock. They like a particular stock based on its current
fundamentals, but we rarely know their motives! Are they telling us to buy
while at the same time telling their customers to sell or selling themselves?
Or do they just not have a real clue? Who knows? Why is it, for example, that
when you see a magazine’s cover featuring a company that has done well, it’s
price invariably falls over the next six months? This last is a well-known
contrarian indicator. If a company has done well enough to appear on a cover,
every fund that wants it already owns it; consequently, there is little new
buying pressure to further drive price higher. Clearly, near term fundamentals,
which is what these so-called experts are basing their opinion on, don’t tell
the whole story.
Charts like the
one drawn for UOPX, on the other hand, track the flow of real money: the actual
buying and selling pressure where people and institutions are putting their
hard-earned money on the line. Charts track the degree of these contrasting
forces that are responsible for pushing the price up or down. It’s worth
understanding the varied patterns of day-to-day price movement, because once you
understand the market’s psychology reflected in these price patterns and
price/volume relationships, you stack the odds in your favor, and the immediate
future—the next few days or weeks at least—becomes more predictable. You’re not
always right, but your odds are more favorable, and when you are wrong, your
money management rules limit your losses. The market plays out the same
pattern over and over again. Learn and profit.
Candlestick Patterns: a Reflection of Market Psychology
Candlestick
charts, like those daily bars in the UOPX chart above, were developed in the
east. Unlike the west, which marks today’s close in relation to yesterday’s as
the most important charting event, the east feels that today’s open in relation
to today’s close is a far more important event in tracking market psychology.
Figure 3 shows 13 days of price movement charted as daily candlesticks. Note,
each day’s bar is made up of a rectangle (the candle’s body marking the opening
and the closing) with whiskers protruding from the top and bottom of each
rectangle (the daily highs and lows).
Further along in the book
Appendix 2: Risk Control or The Science of Money Management
If there’s a golden goose in stock
trading or investment, it’s sound money management strategies. This aspect
separates stock market professionals from the amateurs that routinely buy at the
top, panic, and then sell at the bottom or just buy and hold for the long term
(and watch their EMC drop from $110 per share to under $10). In every
transaction, one should define risk, i.e., a maximum loss point, before buying.
One needs a strategy to decide how many shares to buy, when to buy those shares,
and under what conditions to sell them at either a loss or profit. I prefer
buying pullbacks to breakouts simply to better define and control my losses.
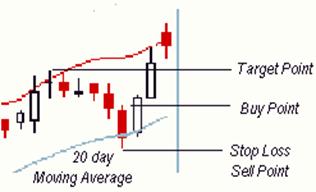
For purpose of this discussion, let’s assume that
you have a $100,000 trading account from which you’re willing to lose $1000 on
any single transaction. Assume too, in the trade shown in Figure 5, your buy
point is $20, your stop-loss point is $19, and your target point is $21. If you
limit your maximum loss to $1,000, you can buy
Number of Shares = $1,000 /
(buy point – stop-loss point)
= $1,000 / ($20 - $19)
= 1,000 Shares
|
Comments or Questions (TSM Service, Methodology, Performance or Your Success Stories)
Here
Copyright Information
The contents of this report are protected by international copyright and
trademark laws. Unless otherwise indicated, Richard W. Miller remains the owner
of the copyright to all printed material, images, figures, and tables contained
herein. You are not permitted to copy, reproduce, republish, upload, post,
transmit, modify or distribute, in any manner, any textual or graphic material
in this report without the expressed consent of Richard W. Miller. Using any
Richard W. Miller written material, imagery, figures, or tables on commercial or
non-commercial web sites without permission of Richard W. Miller is prohibited.
Please be informed that the © Copyright (2003) by Richard W. Miller notice
appears prominently (at the bottom) on each page of this report. Question on
copyright, usage or re-publication? Please contact Richard W. Miller via
email: rmiller@triplescreenmethod.com.
Disclaimer: It should not
be assumed that the methods, techniques, or indicators presented in these pages
will be profitable or that they will not result in losses. Past results are not
necessarily indicative of future results. Examples presented on these pages are
for educational purposes only. These setups are not solicitations of any order
to buy or sell. The author assumes no responsibility for your trading results.
There is a high degree of risk in trading. I am not recommending that you
purchase or short stocks or options using the techniques and methods presented
in this report. Trading should be based on your personal understanding of market
conditions, price patterns, and risk. I present here information to contribute
to your understanding a technique that has worked well for me.
|