"An Approach to Successful Stock Trading Combining Company Fundamentals with Chart Technicals"
Trader's Corner 59 Articles "2003-2008"- Just $21.25
 - 1st Edition Published 6/02/08
 

  Learn About...

      Combining Company Fundamentals, Stock Value
             and Chart Technicals Plus Much More

               (many updated from their 1st publication)

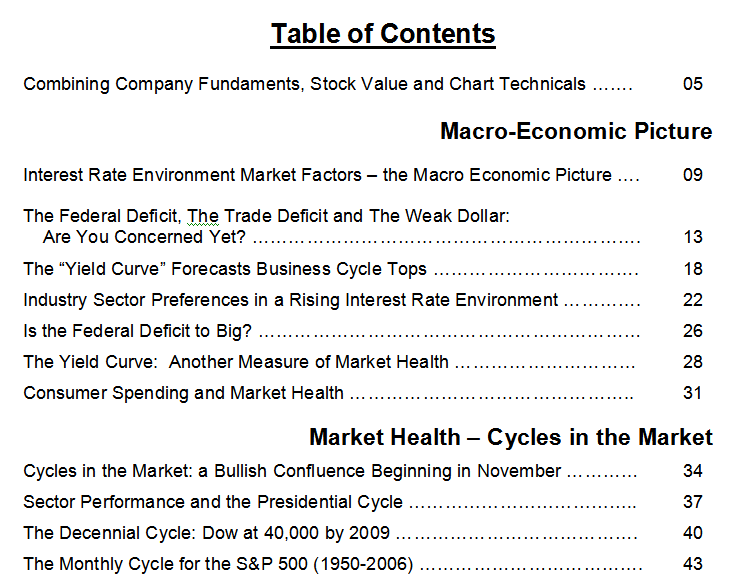
  • Macro-Economic Picture (7 Articles)

  • Market Health - Cycles in the Market (5 Articles)

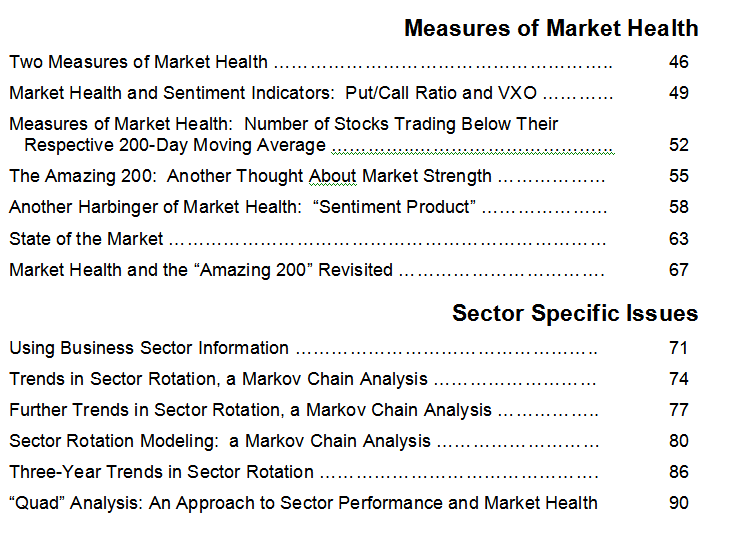
  • Measures of Market Health - (7 Articles)

  • Sector Specific Issues (9 Articles)

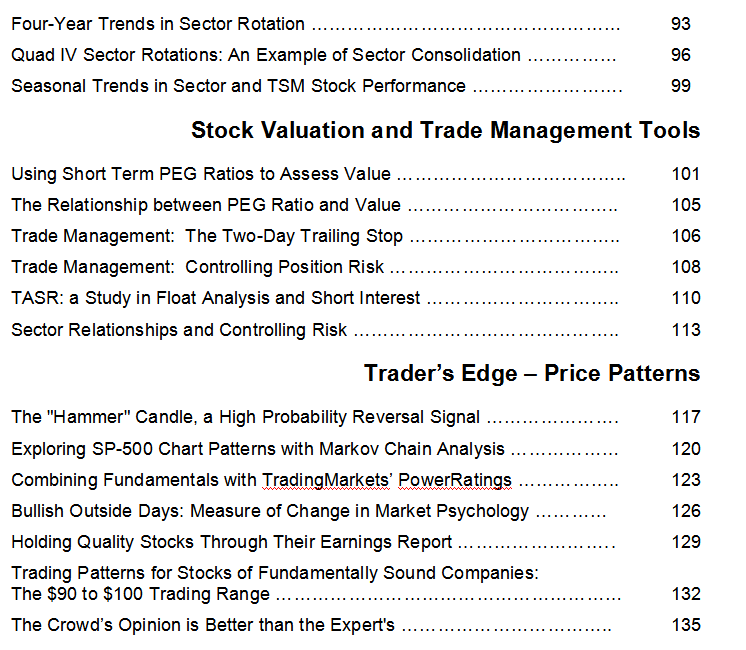
  • Stock Valuation and Trade Management Tools (6 Articles)

  • Trader's Edge - Price Patterns (7 Articles)

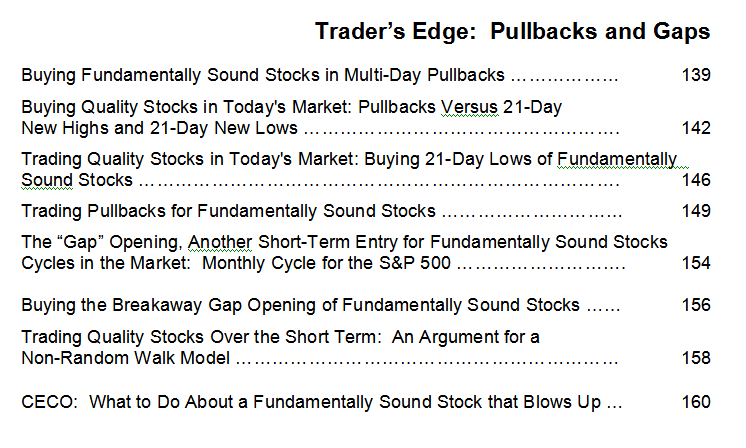
  • Trader's Edge - Pullbacks and Gaps (9 Articles)

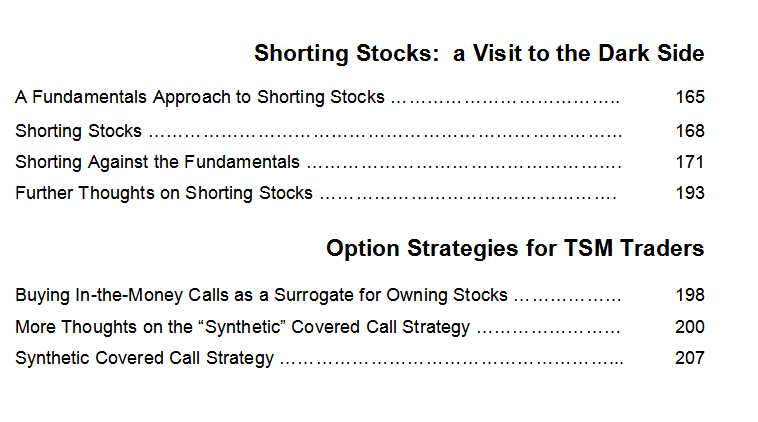
  • Shorting Stocks - A Visit to the Dark Side (5 Articles)

  • Option Strategies for TSM Traders (3 Articles)

  •  Trading Intra-Day (1 Article)


Spiral Bound Hard Copy (2nd Edition) - $21.97 Plus Shipping

or  PDF file - $5

Link to Publisher and 10-Page Preview Here


Trader's Corner 59 Articles

1st Edition (5/31/08)


A Series of Investment/Trader Articles

by

 Richard W. Miller, Ph.D.


                                                                                   Day Traders Edge

  Trading Intra-Day is All About Finding an Edge ..............................................              210


 Excerpt:  1st Article

**************

Combining Company Fundaments, Stock Value, and Chart Technicals (September ’05)

CANSLIM is an acronym coined by William O’Neil, founder of “Investor’s Business Daily” (IBD), to describe those fundamental characteristics common to many companies that have made huge price runs over past decades, so called10-baggersl.  This acronym highlights an investment style, more specifically, a list of attributes desired in each new investment:

            C –    Current Earnings Growth

            A –    Annual Earnings Growth

            N –    Something New:  Products, Services, Management, Price High

            S –    Supply & Demand of Shares

            L –    Leader in the Market, Group and Sector

            I –     Institutional Ownership

            M –   Market Health


            Compare this to “Rule #1” author Phil Town’s four “Ms”:  business that has Meaning to you with a wide Moat, with great Management and finally with a big Margin of safety, i.e., lots of value at the current price.

As a short-term “swing trader,” who wants to trade fundamentally sound stocks, the usefulness of this approach to defining fundamentals lies in IBD’s proprietary ranking scheme.  It allows one to rank the universe of stocks and their respective business groups by a number of criteria that I won’t go into here.   Suffice it to say that one’s able to qualify stocks of interest quickly. 

IBD’s 85-85 Index, for example, is a group of ~100 stocks that are in the top 15% of all publicly traded companies with respect to short and long term earnings criteria and to price performance over the past 12 months. Fundamentally, they’re the best of the best.  This index is up over 70% since 2001, a period over which the S&P 500 still remains in the red. For the trader looking to incorporate fundamentals, this ranking serves to limit the universe that he combs for technical set ups.   A number of other IBD groupings have performed well over time too, e.g., the IBD 100, Big Cap 20, Composite 95, New America lists have similarly performed well.

            Another fundamental criteria important to short-term price appreciation is the pattern of a company’s recent earnings revisions.  If earnings, earnings growth, and earnings stability over time drives longer-term price appreciation, their revision adds fuel over the shorter term.  Zacks accumulates these revisions from analysts and uses them in their own proprietary ranking scheme.  Their results have been impressive as well:  Zacks number 1 ranked stocks have average a +32.8% annual return since 1988, an impressive +43% return over the 2000-to-2002 worst bear market in 60 years.

            But IBD and Zacks ranking fundamentals are not enough for the short-term trader.  Perceived value is another important factor.  One can identify the best stock in the world, but if everyone else has as well, it’s probably overpriced.  For my money, the best predictor of value is the short-term PEG ratio (Price to Earnings to Earnings Growth), specifically ratios calculated from the next two years of projected earnings growth.  Why?  Analysts do one thing well and that’s project earnings over the immediate future, not rank stocks and certainly not forecast long-term growth rates. 

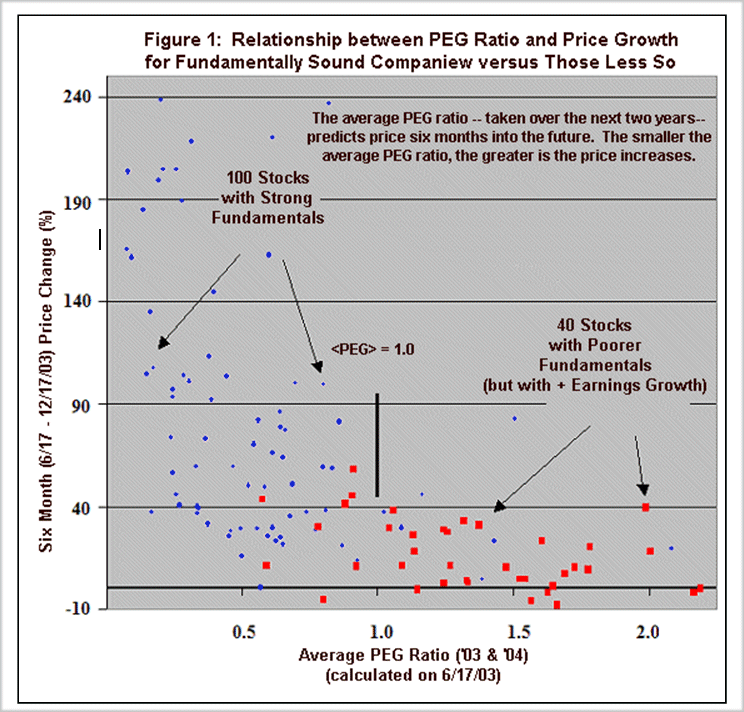
            Figure 1 shows how short-term PEG ratios (the smaller the ratio the greater the value) used in combination with fundamentally sound companies performed over a six-month period in 2003.  Clearly, the respective PEG ratios were predictive of superior price growth over the following six months for those companies with the superior fundamentals

            As a fundamentally driven trader, I use these type criteria to establish a trading list to scour nightly for technical patterns, in particular for pullbacks to the support of major moving averages or prior reversal areas (peaks or valleys). 

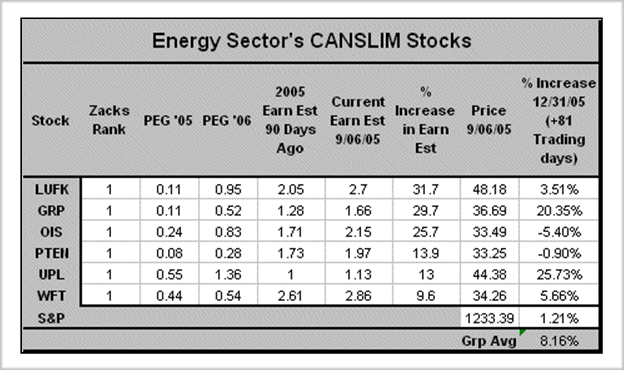
The Energy Sector offers several candidates (listed in the table below) that meet the above criteria.  Technically, most are now pulling back mode.  After the fact (5/14/08 as I write this), the return for the rest of the year for each of these stocks can be contrasted against that of the S&P.  Their average gain was +8.16% (two over 20% and one with a -5.4% loss) while that of the S&P was +1.21%--nearly seven times as large.  Fundamentals mixed with technical trading signals provide one a foundation for trading success.


Copyright Information The contents of this report are protected by international copyright and trademark laws. Unless otherwise indicated, Richard W. Miller remains the owner of the copyright to all printed material, images, figures, and tables contained herein. You are not permitted to copy, reproduce, republish, upload, post, transmit, modify or distribute, in any manner, any textual or graphic material in this report without the expressed consent of Richard W. Miller. Using any Richard W. Miller written material, imagery, figures, or tables on commercial or non-commercial web sites without permission of Richard W. Miller is prohibited. Please be informed that the © Copyright (2003) by Richard W. Miller notice appears prominently (at the bottom) on each page of this report.   Question on copyright, usage or re-publication? Please contact Richard W. Miller via  email: rmiller@triplescreenmethod.com.

Disclaimer:   It should not be assumed that the methods, techniques, or indicators presented in these pages will be profitable or that they will not result in losses. Past results are not necessarily indicative of future results. Examples presented on these pages are for educational purposes only. These setups are not solicitations of any order to buy or sell. The author assumes no responsibility for your trading results. There is a high degree of risk in trading. I am not recommending that you purchase or short stocks or options using the techniques and methods presented in this report. Trading should be based on your personal understanding of market conditions, price patterns, and risk. I present here information to contribute to your understanding a technique that has worked well for me.