| 07/27/12 ... Hedging with
Inverse Funds Here's an example of how one might hedge the
coming bear market (read Harry Dent's "The Great Crash Ahead").. Six
stocks that would be expected to hold up well in such a down turn (DG, WMT,
MCD, WPI, UNH and PM) are combined with six liquid inverse ETFs (RWM, SH,
EUM, EFZ, PSQ and SEF) in a 100 percent hedge strategy. Note, fewer inverse
funds would have reduced the degree of hedge, while double and triple
inverse funds could increase it, i.e., 6 long stocks combined with three
double inverse funds would be completely hedged, e.g., SDS bears a 2x
inverse relationship to SPY, SH a 1x inverse relationship.
Each of the above 12 have hypothetically been
invested with $10,000 on 01/01/2011. The solid red line tracks the
growth of the hedged group; the green line its polynomial fit; and the
broken red line its percent return for the year (19.7 vs 8.0% for the S&P). The
solid blue line similarly tracks the S&P, the yellow line its polynomial
fit, and the broken line its return. Clearly, this hedged grouping has
not only outperformed but also has experienced less volatility. The
maximum drawdown (peak price to following low) for the hedged portfolio was -5.1%, while that for the S&P
has been -19.4% over this time frame. Note, another advantage offered by this type hedge is that all the trades are long, so the
strategy can be used in in IRA account.
When the market is climbing, like it has been
between Nov '11 and Apr '12, a hedged position suffers in relation to it.
Too, the long position in the hedge would be better served by changing the
long positions to current TSM top picks rather than letting our initial ones
ride. As the market turns bullish, especially in the good seven months of
the year, it's better to put on less of a hedge--say 20 percent instead of
the 100 percent used in this example. Good return with minimal
drawdown!
05/13/17...Hedging
with the VIX...One
of the hedge vehicles that you hear discussed today is the volatility index
of the S&P'soptions,
the VIX. As shown in the chart below, the VIX is a linear function of the %
DrawDown of the S&P, especially so up to 20% DrawDowns. The relationship
forecasts that a 20% DrawDown in the S&P will result in a 11.4 point
increase in the VIX. Trading at 10.4 at Friday's close (05/12/17), this is
more than a 100% increase in the VIX, i.e., the percentage change in the VIX
magnifies the change in the S&P. Typically, the VIX will trade rise more
than 5 times the size of the S&P drawdown in a market sell off.
This means that I might buy $50,000 of VIXY (short-term VIX ETF) and expect
a $25,000 gain to offset some of my portfolio loss.
An interesting article: How
to Go Long on the VIX Index
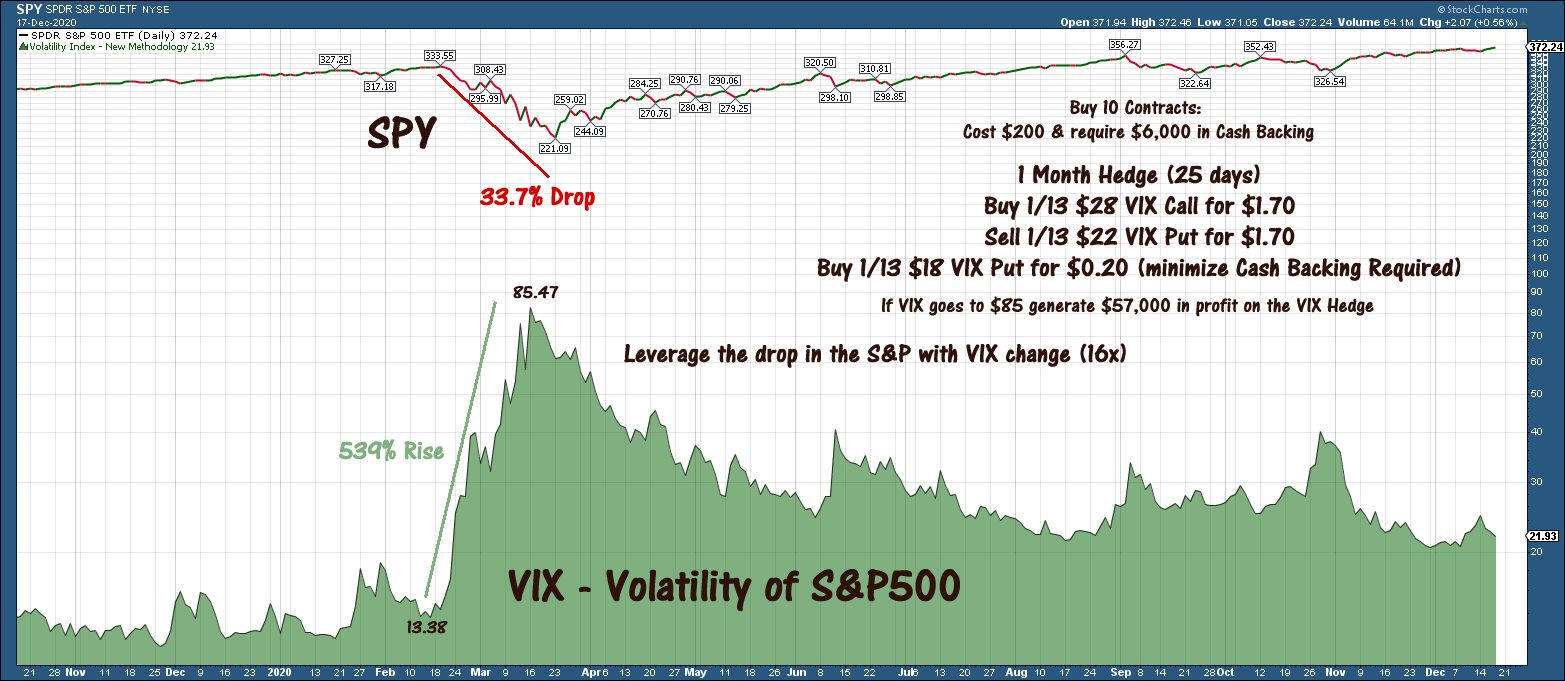
12/28/20...My Current Thoughts on Hedging with VIX Calls & Puts...
Hedging your portfolio is much
cheaper than just allowing it to fall with the market, like in 2008-2009
when the S&P fell over 50% and just recently in March when it fell 33%.
This approach is far cheaper than simply buying S&P Puts.
Here's an example of a VIX hedge on
the S&P using Puts and Calls: buy out-of-the-money VIX Call, Sell
at-the-money VIX Put and buy out-of-the-money VIX Put (to minimize cash
backing required). Simply put, over the next 25 days, this $200 hedge
cost for 10 contracts could generate $57,000 if the VIX acted as it did
in the March pullback. The idea is that when the market gets shaky, I
could put this hedge on each month. The VIX could fall and I would just
lose my $200 for the month and possibly more from my short Puts, so you
have to be careful when using this approach. I'll just watch for an
opportunity, possibly when the market's bad five months starting May 1st
or sooner if the new administration's policies hurt the economy.

I've written about a VIX hedge
strategy that combines a long out-of-the-money Call with a short
at-the-money Put and a long out-of-the money Put. This is a hedge that's
written with one month to expiration.
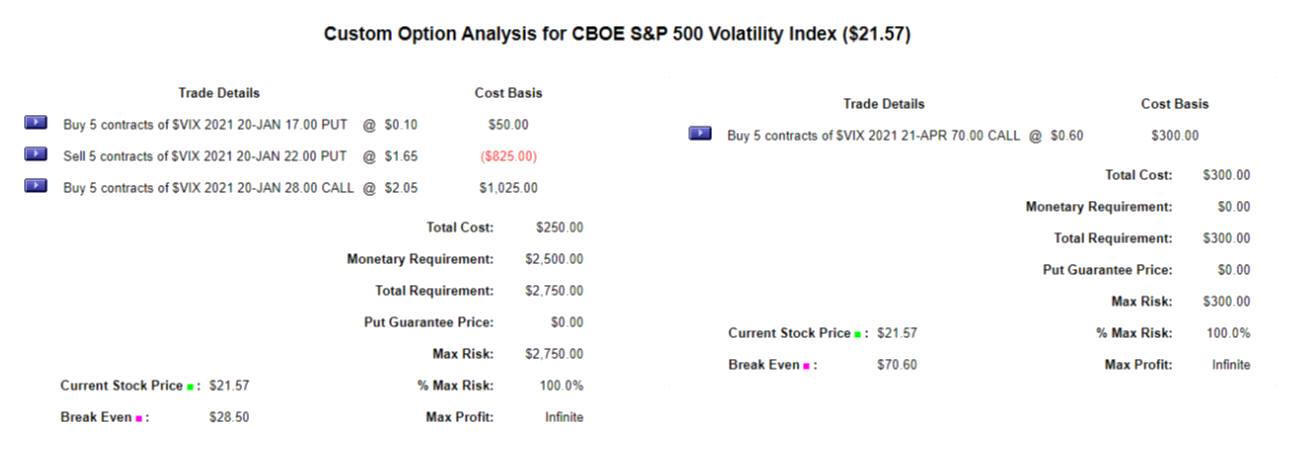
The option alpha group presented a
simpler VIX strategy that they had back tested extensively: a long VIX
Call at a 0.10 delta with 120 Days to expiration.
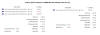
Here, I contrast these two VIX hedge
strategies. Strategy 1 is the $70 VIX Call with an April 21st expiration
(122 days with delta 0.10). Strategy 2 is the three option strategy
(here the Jan 20 expirations of the $28 Call and the $22 and $17 Puts).
The two strategies are outlined in the first chart. Clearly, the first
strategy requires less upfront cash and has a much lower maximum risk.
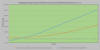
The second chart shows the
profit/loss diagram for five contracts at various VIX values if each
hedge was closed on 1/15/20, one week before the second strategy would
expire.
Clearly, strategy 2 (blue) performs
far better beyond a VIX $26 close and underperforms below a $22 a VIX
close.
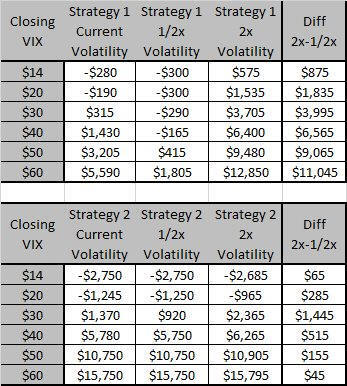
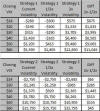
The next question: how is each
strategy impacted by a change in volatility?
The table shows the impact of
volatility on both VIX strategies. I looked at the profit/loss generated
by current, one-half, and two times volatilities. Clearly, strategy 2,
the multiple option strategy, had far less dependence on volatility,
which strategy 1 would benefit greatly from an increase in volatility,
as would be expected for any long-Call position.
02/17/21...More Thoughts on Hedging with VIX Calls & Puts...
These
days, I'm hedging most of my positions: Covered Calls on shares I'm
holding; deeper downside protection or spreads on Short Puts; and a VIX
hedge against the general market. Here, I'll share recent data about the
VIX hedge.
The VIX is an ideal market hedge because it magnifies the downside
market movement by a factor of 5 to 10 (or more in extreme market
moves). I use it primarily to guard against major market excursions like
last March (or worse, like 2000 and 2008).
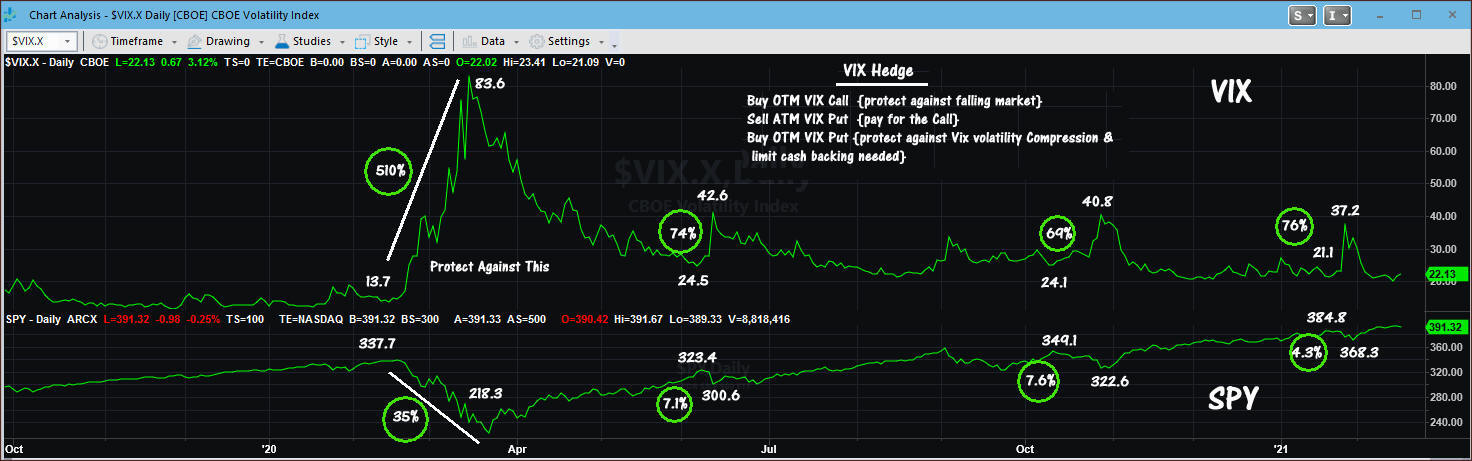
The VIX
Hedge has three legs: long OTM Calls (captures the market's movement),
short ATM Puts (partially pays for the Calls), and long OTM Puts
(protects against VIX volatility compression and limits the necessary
cash backing).
When the
VIX is stable, having fallen back after a market excursion, I leg into
my VIX hedge, two contracts at a time, building to 10-20 contracts. When
the VIX is rising, I'll similarly leg out of the hedge, taking profits
and closing enough contracts to pay for the original hedge (the short
Put doesn't cover the entire cost).
The
chart shows how the VIX responded last year to four market pullbacks: in
March, the market fell 35%, and the VIX rose 510%; in June it fell 7.1%,
and the VIX rose 74%; in October, the market fell 7.6%, and the VIX rose
69%; and in January of this year, the market fell 4.3%, and the VIX rose
76%. I sold my hedge into most of these market moves, then rebuilt the
hedge when the market recovered, and the VIX reverted. Not once,
however, did the VIX hedges I put on last year cost me anything. In
fact, the last one made over $1,000.
Another tweak I like to use is to
buy back the short Put when the market has fallen enough to reduce the
cost of these Puts. For example, my current short Put (4/21 $23 VIX Put)
paid me $1.66/share; I'll buy it back at a cost of $0.30 or lower if the
VIX rises enough. I leave the long Put in place, however, as it would be
worth pennies at that point.
 |