|
|
|
|
"An Approach
to Successful Stock Trading Combining Company Fundamentals with Chart Technicals" |
|
|
Comments or Questions (TSM Service, Methodology, Performance or Your Success Stories) Go Here - (rmiller@triplescreenmethod.com) |
|
TSM Methodology & Results
for Last 55
Quarters (4,245 Half-Position Trades)
TSM Stock Performance (55 Quarters from 2003 through 2017) - See TSM Lessons Here
A list of new TSM picks (accumulated from 51 fundamental, a value, and an earnings quality/revision screen) is published in Monday's TSM Report: 120 to 250 stocks with strong fundamentals, with projected quality earning’s performance (Zacks), and with remaining value (two year PEG ratios). This is the list that I search daily over the next week looking for those stocks giving strong technical signals (usually pullbacks), i.e., those stocks that are likely to make a bullish run over the next 1 to 10 days. The quality of the pullback can be characterized by its 2-period RSI: two consecutive closes below 5 provides an excellent buying opportunity either at the close or at the next day's open. I prefer to buy pullbacks falling to obvious areas of support.
During two quarters in 2006, for example, 174 picks (longs and shorts) were forecast in the daily TSM reports, each with their respective buy/short points and profit and loss targets: 164 (94.25%) gained at least $0.25, 152 (87.36%) gained at least $0.50, 140 (80.46%) gained at least $0.75, 129 (74.14%) gained at least $1.00, 99 (56.90%) gained at least $1.50, 76 (43.68%) gained at least $2.00, 52 (29.89%) gained at least $2.50, 32 (18.39%) gained at least $3.00 and 18 (10.34%) gained at least $3.00.
Yearly results for TSM forecasted stocks are summarized in the following table. Bottom line: in an economic climate that restricted the S&P 500 to a +100.7 percent gain, the TSM stocks have gained 9,695 percent; a $35,000 account would have grown to $3,427,593 in 49 quarters. Perhaps most impressive were the results in 2008: when the S&P fell -38.5 percent, the TSM stocks returned an impressive +110.7percent, as short-term stock picking was virtually the only strategy for success because of the constant sector rotation of money.
Here's how I recommend you use TSM data. First, look at the "Market Update" for a technical comment on today's market (S&P 500), comments on current economic conditions, and watch outs for historical factors, like the 7/5-monthly cycle. Did you know, for instance, that if you had invested in Value Line's Arithemetic Index (1700 equally weighted stocks) $50,000 selectively in only the good seven months of the year from 1984 through 2013, that stake would have grown to $2,194,688, while a similar amount invested exclusively in the bad six months would have fallen to $35,630 over the 26 year period?
Next, move to a discussion of "TSM Stock 'Picks of the Day' " highlights 1-4 stock trade, each a long, that combines TSM's unique qualification of fundamentals, earnings revision fuel, and remaining value at its current price with technical patterns ripe for buying or shorting. About 20 picks will be made each month, and each will have its own trade management criteria: both profit ranges and stop loss points to sell half positions. Open positions are forecasted, tracked and updated daily (see the Index box on the daily report, "TSM Performance (Current Quarter)"). Find a list here of all closed TSM trades forecast over the first 30 quarters from 2003 to 2011.
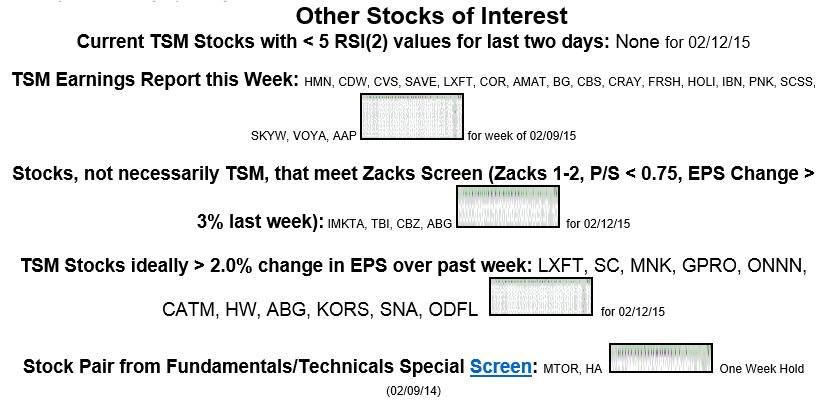
You can find potential TSM (and other) picks in the TSM Daily Report that arise from strategies developed for trading stocks with quality fundamentals and value, e.g., the Earnings Report Rebound and the Earnings Estimate Increase. Each daily report will include the following section (note, the postage size inclusions provide fundamentals for all the highlighted stocks:
In addition to the TSM stock trades, most daily reports will contain a list of potential Naked Put Positions. This list is chosen to meet return (> 10 percent annualized) and downside protection (from 5 to 15 percent depending on time to expiration) criteria. Usually, from one to 10 opportunities are presented as the best from the 1,000s available for this group of TSM stocks.
Find a Subscriber's Introduction
here and a
report on the Short Put Trade
here.
If you're interested in learning Day-Trading Methodology, particularly for TSM
stocks, the "
Day-Trading Edge" provides statistical
edges that are constantly being developed. For example, over 52 trading
days between 11/05/07 and 1/18/08, 80 percent of the time AAPL made either its
high or low of the day in its first hour of trading. And over 80 percent of the
time AAPL traded at least $1 higher and $1 lower than its prior day's close.
Both provide trading edges important to the day trader, as I write this (04/11/08), TSM
has developed six such trading edges. Others are sure to come. So, how has the TSM
approach performed? Very well is the simple answer. Over a 45-quarter
period between 4th quarter 2003 through 2014, 3,134 half-position trades were forecast (mostly long but a few short and
inverse ETF plays): 2,741 winners and 1,012 losers for a 73
average percent win rate. Find
a complete breakdown by quarters here.
Only one quarter
did the TSM approach actually lose money (-6.22 percent in 3rd Q or
'03). The average trade lasted 6.7 days, and a $35,000
account would have grown to $2,909,493 (6,560 percent return) while
the S&P gained 112 percent over the same period. See Results
for further
information. Finally,
take a look at the "Trader's Corner."
It offers a series of articles aimed at teaching the components of the TSM approach.
Is TSM the "golden goose" that will make you
millions? No. TSM is a sound approach to
picking quality stocks for longs. Its Short Put
strategy is a sound strategy to earn a decent return on your
pile of cash (in today's market something you cannot do
easily other places). Even so, it's stringent trade
management criteria (profit and stop-loss targets for 1/2
position trades) result in profit only 73 percent of the
time. Albeit, over 98 percent of the picks are
profitable during the trade's life but some 27 percent don't meet the TSM
profit target and get stopped out for a loss. The market's true
"golden goose" is sound trade management. Don't let
anyone ever tell you different.
The most foolish refrain heard concerning
stock investment: "It's a quality company, and its stock
price will recover. I'll just hold and wait this
temporary downturn out!"
Good luck and good trading,
Ric Miller,
Ph.D. and Master 6-Sigma Master Black Belt
Statistician
Returns 2003 (4th quarter) through 2017: With the close of 2013's 4th quarter, let's summarize all 45 complete quarters in which long trades have been forecasted since 9/15/03. Results are in the accompanying Chart and Table. The TSM approach primarily buys undervalued, fundamentally sound stocks giving quality technical entry points: primarily pullbacks. Each entry is accompanied by profit and loss exit points: two for profit, as shown in an earlier chart above.
Truthfully, the TSM approach is at its best in a bullish,
trending market, but having said that, it
performed very well in 2008, a time when the S&P
dropped 38% It's based on a sound
combination of technical and fundamental
criteria that are hard to beat. A complete
49-quarter record is shown in the following
table.
TripleScreenMethod (TSM) Methodology and Results for 2003 to 2011 are provided as an example.