TSM Fundamental ScreensOn these pages I'll share the results of proprietary screens that I'm constantly developing. The ideal screen would meet the following criteria:
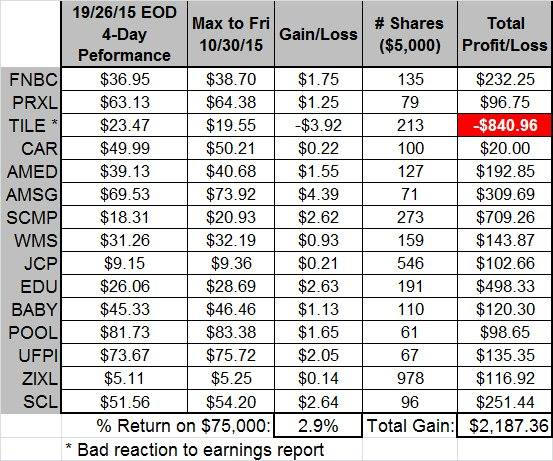
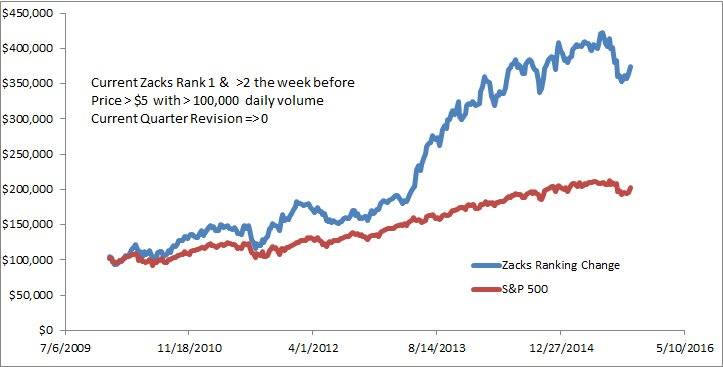
Change in Zacks Ranking from >2 to 1 (11/01/15) On 10/26/15 below (last Monday evening), I listed 15 TSM stocks that were currently ranked 1 by Zacks but had been ranked a 3 or greater the week before. This group would have had an earnings estimate event that caused its ranking to make big positive jump. The table shows the price improvement by the end of the week: Monday's closing price, Max price reached after that, gain/loss, # shares bought with $5,000 ($75,000 for group), # shares, total profit after commissions. One stock, TILE, had a bad reaction to its earnings report, while the other 14 generated profit opportunities ($2,187). In the future, I would not use this strategy with those reporting earnings in the coming week (PRXL was another, but it reacted better).
Getting the absolute max out of each position would be impossible, but this diverse group could easily have generated a $1,000 profit over 4 days. The strategy of trading TSM stocks (a group with quality fundamentals) that have had a big jump in their Zacks ranking is a winner. A list meeting this criteria, with their fundamentals, will be provided each evening in the daily TSM report. Over the past 6 years, this Zacks change grouping returned nearly twice that of the S&P: an average of 11.6 stocks each week versus the 500. Over that period, the annual compounded rates of return were 25.6 and 12.9%, respectively. Adding one other factor, Price-to-Sales ratio < 0.75, and this return doubles. Obviously, this strategy has worked well over this 6-year period.
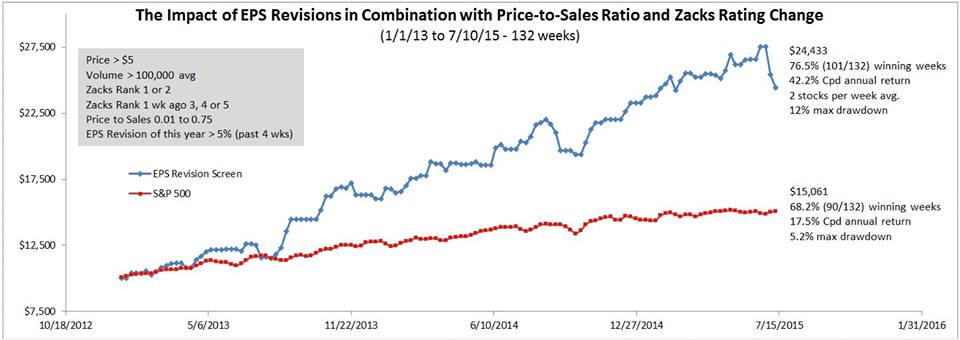
Earnings Revision, Price-to-Sales and Zacks Rankings Change (8/10/15) This screen was run over a recent 132 week period (for 2 week hold period but 1 week hold period produces similar results). It's meant to highlight a few metrics that work in concert to drive stock price over the short term:
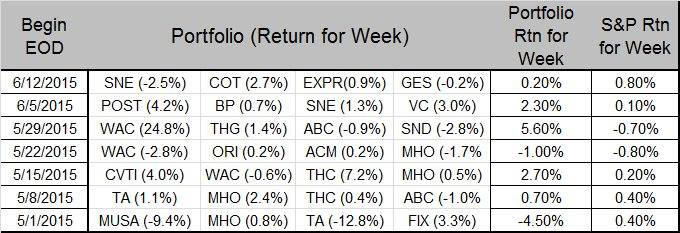
On average, there will be two stocks that meet all of these criteria each week. Over this period, 76.5% of these two-week trades were winners, and the account grew at a 42.2% compounded annual rate. While I'm not suggesting here that one buy these stocks blindly each week necessarily, I would look for these criteria being met in each week's TSM listing and then take a good look at their charts. These fundamental criteria drive price over the short term. The following stocks met the criteria for the coming week: ALDW, CCRN, CDW, ORN, RAIL, REGI. Some will be TSM stocks (haven't identified this week's list yet). The attached table shows their fundamentals.
Industry Performance, Los Price/Sales, Upward Earnings Revisions and Technical Pullback (07/07/11) I've been working on a screen that incorporates the TSM principles:
1. Price > $10
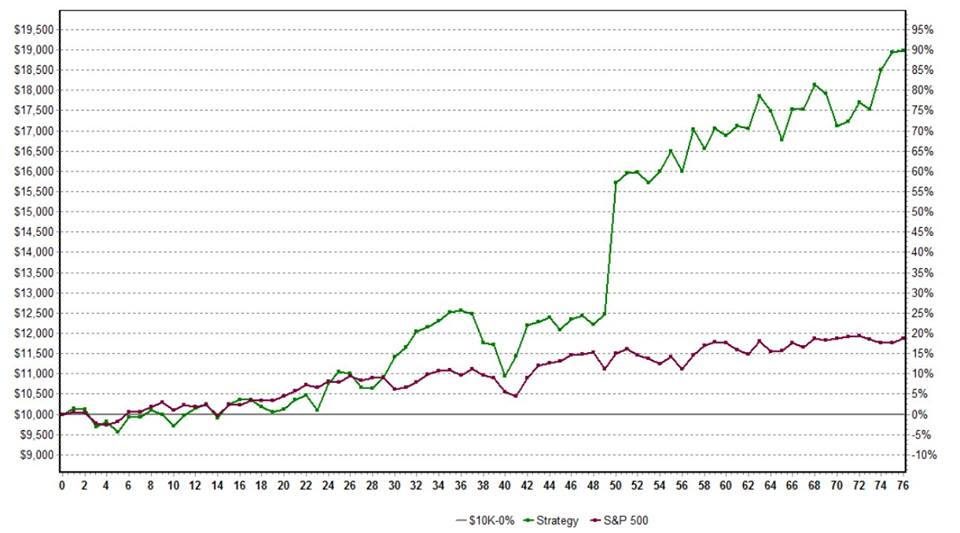
I'm looking for stocks with quality fundamentals and value (Zacks Rank and P/S), that have had a recent, substantial upwards earnings revision but have recently pulled back or consolidated. Over the past 78 weeks (year and a half) this screen has produced the results shown in the chart trading a max of 4 stocks each week. It's overall return was 89.7% compared to the S&P's 18.6%. The portfolio did have one very good week with a single stock (week 50 up 26%), but even excluding that one, the portfolio would have been up 50.6%. The May/June picks and returns are shown in the table, as are picks for next week. Note, this screen uses the closing price Friday as the entry price Monday morning and then sells at Friday's close. I will be improving this screen over time. Results of this screen (or a better one if I find it) will be presented in Sunday's TSM Daily Report.
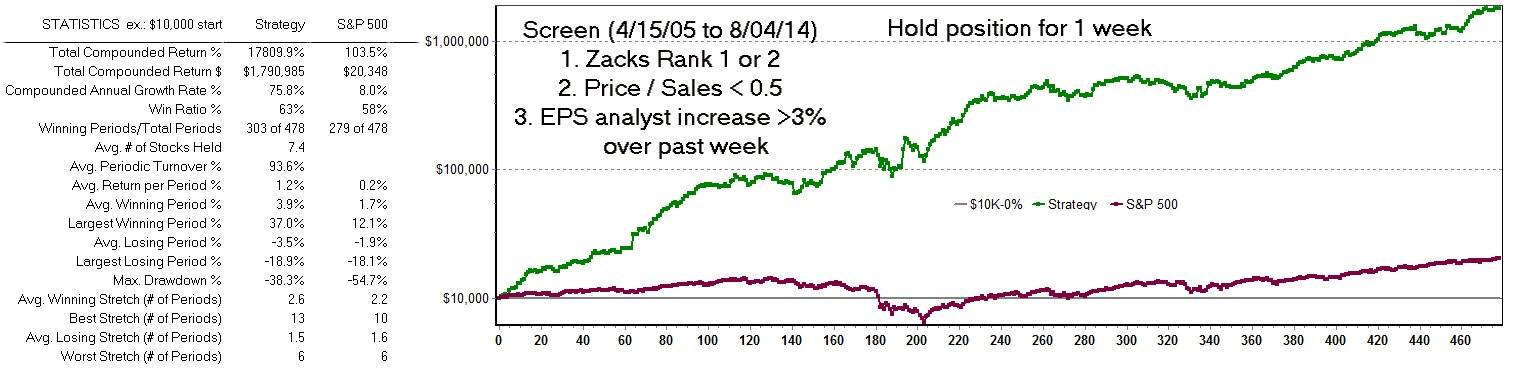
Fundamentals Plus Pullback (08/04/14) The following chart shows the power of fundamentals in short-term stock trading. The combination of Zacks ranking (1 or 2), low Price-to- Sales-Ratio (less than 0.5) coupled with at least a 3% increase in this year's earnings estimate over the past week produced a 75.8% compounded annual return from 4/15/05 to present (versus the S&P's 8%).
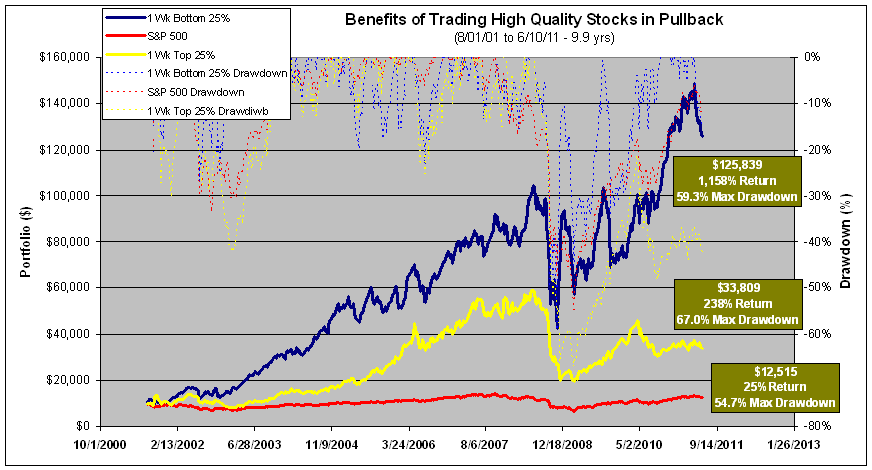
Fundamentals Plus Pullback (06/27/11) I recently ran a screen covering 9.9 years between 2001 and 2011 over periods of both strong and weak markets (even the extremely weak 2008). The universe of stocks tested met these constraints:
Over 516 weeks (starting in 08/01/01), from those stocks meeting the above constraints, one screen bought the worst 4 stocks in terms of price growth over the preceding week, while another bought the best 4. The following chart shows how each performed utilizing a one week holding period and contrasts each one's results against the S&P's return over the same period. While the Zacks #1 stocks performed well, buying the pullback was a far better strategy--yielding 5 times the return. Note, very little escaped the 2008 market. A rule that allowed one to trade only bullish markets, like the S&P must be above its 200-day moving average, would have kept one out of the deep drawdowns.
Pullback Versus Breakout for Fundamentally Sound Stocks (03/02/09) This first one demonstrates the power of buying fundamentally sound stocks in pullback rather than breakout and confirms that it's hard to beat a stock with good fundamentals that's in pullback mode. That's why I prefer to trade TSM's daily picks in pullback, even looking to enter buying a position in further pullback rather than buying at breakout prices, though I usually offer both entries for each daily TSM pick. The following chart shows the performance of two investment strategies over the a 479 week period (9.2 years from 12/17/99 to 2/13/09) through both bullish and bearish times. Note, the S&P 500's performance is included as a benchmark (and the y-axis is a log scale). Each strategy begins with $10,000 and has its holdings updated each week. Over this period, the S&P's equity curve dropped to $5,587 while the first strategy's equity curve rose to $2,096,347 and the second one dropped to $2,127. So what are these two strategies that differ so drastically in their performance? 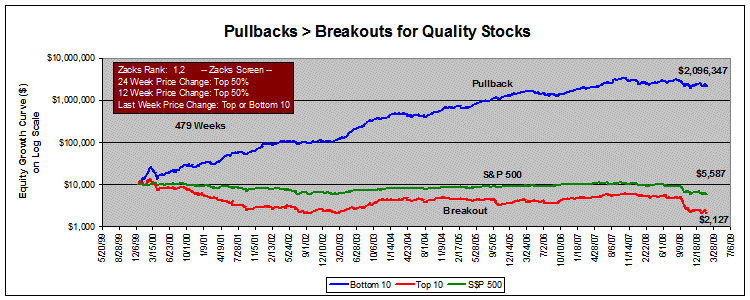 Though I'll keep most of the requirements proprietary, both begin by requiring their stock membership have a Zacks ranking of 1 or 2 (the strong buys and buys); both require their respective picks to be in the top 50 percent in terms of price performance over the past 24 weeks and then that group the top 50 percent price performance over the past 12 weeks. The two differ in their fourth requirement: the strong performing strategy picks the worst 10 performers over the past week (those in pullback), and the weaker performing strategy picks the top 10 performers over the past week (breakout and strong momentum risers). Each week 10 stocks were picked to meet the above criteria. I think you'll agree, the huge performance difference is both counterintuitive and its magnitude surprising. The lessons to be learned from this screen:
My next effort will be aimed at improving the drawdown characteristics. It doesn't matter how great an annual return one gets, if it's susceptible to a 50 percent drawdown, it's not very tradable, i.e., it's tough to sleep at night and trade the strategy.

| | ||||||||