As I write this, the S&P is making all time highs (as is our national
debt). Obviously, the market has been the place to be over the past year,
even as the world has become increasingly dangerous, and the likelihood of a
market turndown on any trigger event likely. At the same time,
interest rates have been held down by the Fed in an attempt to soften our
economic situation, and in so doing, that strategy has made it difficult for
anyone with a pile of money to earn a decent return on it. For
example, a retiree with a $1,000,000 could only earn $25,000 annual
investing in 10-year treasuries. Using the conservative strategy I'll
describe here, that retiree could be earning $150,000.
In this report, I’ll describe that conservative
approach to earning a 15 percent return on your money or to buying quality stocks at big discounts
in price. This
time-tested strategy is built around
selling options (called “writing” options in option jargon), specifically
cash-backed, deep out-of-the-money Puts, to
generate income or buy quality stocks at bargain prices. The
strategy is deemed conservative for two reasons: (1) the underlying stock
has both strong fundamentals and value remaining at its current price; (2) if we are
forced to buy this stock, it's at a 10-25% discount to its current price.
Before describing the strategy
in more detail, let me describe what stock options are for those
of you that might have heard of them but never used them or, worse, for those of
you who think of them as extremely risky strategies.
What
are Options?
Options are simply contracts, most controlling a
100-share block of the underlying stock or Exchange Traded Funds (ETFs). Once your brokerage account has
been properly activated, options are as easy to buy or sell as the stocks
themselves. However, for all but the most heavily traded stocks and ETFs,
the bid/ask spread of an option trade will be wider than that of its underlying
vehicle. They just aren’t as liquid.
Today, one can buy or sell
(write) option contracts on over one-fourth of the stock universe, as well as
on most indices (as ETFs) and other ETF’s as well, e.g., country, sector
specific and even inverse ETFs. Each such vehicle has its own option string,
i.e., a number of different contracts differing in their time of expiration
and their strike price. All effectively expire on the third Friday of their
expiration month (technically on the Saturday). Most can be written for the
next several months, while some can be written years into the future (Leaps).
The underlying vehicles cited in the rest of this report will be stocks.
There are two basic types of options: Calls
and Puts. The value of a Call rises as the price of its underlying stock goes
up, while the value of a Put rises as the price of its underlying stock falls.
A whole arsenal of strategies can then be fashioned around simply buying and/or
selling these Puts and Calls singly or in defined combinations, e.g.,writing
Naked Puts or Covered Calls, going Long Calls, writing or buying Debit and/or
Credit Spreads, etc .
Puts give the buyer of the
contract the right, though not the obligation, to sell to the Put seller (writer
of the contract) the underlying 100 shares of stock at any time up to its
expiration date at a specified price (the option’s strike price)—no matter what
the price of its underlying stock at the time of the sale. Conversely, Calls
give the buyer of the contract the right, but not the obligation to buy stock
from the seller of the Call’s contract at the contract’s strike price. For
these rights, sellers of either option type are paid a premium. Truthfully,
trading options is no more complicated than that, but two analogies should make
their usefulness clearer.
A Put’s Similarity to a Home’s Insurance Policy
A Put acts
like an insurance policy for the buyer in much the same way an insurance policy
protects your home. You, the homeowner (Put buyer) buy the insurance from the
insurance writer (Put writer) to protect against a catastrophic loss. The
insurance writer (like State Farm), on the opposite side of the transaction,
collects the premium and profits from insuring these low-probability losses.
Sometimes a hurricane Ivan happens, but most times the insurance company sits
back, collects premium and grows rich (it’s been Warren Buffet’s road to
riches).
Back to Put options, the writer
of the Put is paid the option’s premium and, for doing so, guarantees the Put
buyer that he will buy the underling stock at an agreed upon price (the strike
price) at any time up to the option’s expiration date at the Put owner’s
discretion. The writer of the Put, in effect, writes an insurance policy for
the buyer of the Put: the seller gets the premium (income), and the buyer gets
the guarantee that his stock’s price can not fall below the option’s strike
price through the option’s expiration date.
Note, a cash-backed Put writer will have his cash
escrowed in his brokerage account when he writes a Put so if he's forced to take
possession of the shares when the price falls below the Put's strike price, it happens immediately.
For example, if stock XYZ were trading at $50,
and one purchased its $50 Put for $3—one that expired in 30 days—the Put buyer
is betting that between now and 30 days from now XYZ will finish below
$47. The writer of the Put, on the other hand, thinks
XYZ will hold its value or rise over the next 30 days and just wants the $3 for income or, failing that, wants ultimately to
own XYZ {trading at $50 today} at the reduced price of $47 if he’s later forced
to buy the stock's drop. The buyer controls that $50 stock for three months at a fraction of its
value (just $3 versus $50). What makes this option trade more risky than
shorting the stock outright is that the Put seller's total liability should
the stock rise say to $75 is again limited to the $3 premium (unlike the $25 full
loss experienced by the short seller).
Typically, buying Puts serve two
purposes: (1) someone believes a stock’s price is ready to fall and wants to
trade that way, or (2) someone holding a stock position wants to protect from a
collapse (i.e., they want to hedge their portfolio)—a kind of
insurance if you will. Those writing Puts similarly do so for two
purposes: (1) to generate an income stream but not own the stock, or (2) as a
strategy to buy stocks tomorrow at a cheaper price than it's trading at today. It’s
these latter two strategies that are developed in this report.
Calls give buyers the right, but not the
obligation, to buy a stock up to some specified point in the future at a
specified price. They are betting on a price rise in the underlying stock
and are leveraging their cost, while sellers again look to generate income. If
the seller already owns the stock on which he is writing Calls, the options are
commonly referred to as “Covered” Calls. I'll say no more here about
strategies involving Calls, though I frequently write covered Calls to mitigate
risk when shares are put to me.
Now, let me add some prospective
to option buying and selling. Once you understand the probabilities involved in
trading options, you will look for strategies that involve selling options
(writing Calls and Puts) to
take advantage of the high likelihood for options to expire worthless.
Options Tend to Expire Worthless
A study analyzing three years of
data (1997-1999), compiled by the Chicago Mercantile Exchange, confirms that
option sellers are the true winners over option buyers (John Summa, “Option Sellers
vs. Buyers: Who Wins?,” Futures Magazine, March 2003). His
study, based on the option characteristics of five commodity markets (S&P 500
index, Nasdaq 100 index, Eurodollar, Japanese yen, and live cattle), showed that
over this three-year period an average of 76.5 percent of all options expired
worthless. Even during this bull market period where prices were rising
greatly, 74.9 percent of all Call options expired worthless and 82.6 percent of
all Put options did likewise. Three patterns emerged from the study: (1) three
of four options held to expiration expired worthless; (2) the percentage of Puts
to Calls expiring worthless depended on the primary market trend; and (3) option
sellers were invariably the winners.
The Short Put Strategy
With that as an introduction, let’s see how one can mold these Puts into an effective income
strategy, one that can consistently generate a 15% return on quality stocks. You’ll notice that most calculations ignore commissions ($1 per
contract for me), and sells are conducted at bid prices and buys at ask prices.
Too, understand that if the underlying stock's price drops below the Put's
strike price at expiration, that stock is put to you at the strike price cost.
Tips on Writing Naked Puts
Writing deep, out-of-the-money Puts, as a strategy, is more conservative than
just buying stocks. Consider, over the next 30 days, a
stock’s price can do one of five things: go up a lot, go up
a little, stay the same, go down a little or go
down a lot. The stock owner profits in two of those
scenarios, while the Put writer makes money in four of the
five and still doesn’t lose as much as the stock owner in
the fifth when the “stock falls a lot.” Admittedly
though, the Put seller doesn’t make as much as the stock
owner when the stock goes up a lot. Having made that
point, let me offer a few tips on using this strategy.
Tip 1:
Write Puts on fundamentally sound stocks that you wouldn’t mind owning
at substantially reduced prices (TSM stocks meet this
criteria);
Tip 2:
Make sure underlying stock’s price lies above its 200-day
moving average, as that’s an indication that this particular
stock’s price has not broken down and lost its institutional
support; if possible too, write a Put whose strike price
falls below a major area of support;
Tip 3:
Put premiums become richer in uncertain times, as people
rush to buy protective Puts, so one can write deeper
out-of-the-money Puts and still get his targeted return, say 15 percent
annualized;
Tip 4:
In an uncertain, bearish market, trade smaller size and demand
greater downside protection;
Tip 5:
Trade liquid Puts with bid/ask spreads less than $0.25 in
case the trade goes against you and needs to be closed;
Tip 6:
To reduce risk trade write Puts with 15-30 days till
expiration; note, this is not the same as closing early a
longer term option because those will be impacted negatively
by increases in volatility, while the former is a rapidly
depreciating asset;
Tip 7:
Be particularly aware of when the next earning’s report is
coming out
because premium inflates as that date approaches; further,
the risk of a post-report selloff increases in an edgy
market;
Tip 8:
Quality stocks that have pulled back (ideally where we want
to write the option) are apt to bounce higher quickly and
significantly reduce the premium of a short Put position; as
soon as a short put position is created, place a limit order that closes the order
automatically (for me, when the Put is worth $0.05) because
(1) the risk/reward is not in your favor and (2) that capital can be redeployed
in a new short Put at
a higher rate of return;
Tip 9:
Write Puts on stocks that have pulled back into an area of
support, e.g., 20/50/200 day moving averages or prior highs
or lows.
Tip 10:
Always understand the level of downside protection with a
new Put position and favor getting better downside
protection over getting higher yields.
Identifying Fundamentally Sound Stocks to Write Puts On
The
TripleScreenMethod approach to identifying stocks used in
writing Puts is to run 32 fundamentally based screens from a
number of commercial services, e.g., IBD, Value Line,
TheStreet, Navellier, Zacks and many others. Once this
weekly list is generated (2,000 to 3,000 entries), cross
screen references are noted, and then the list is reduced by
requiring:
-
Zacks ranking of 1-3
with 3s forced to have a market cap greater than $9
billion
-
Daily average volume
greater than 100k
-
Two-year PEG ratios
less than 1.5, ideally less than 1.0
At this point 250-350 stocks have been identified for
trading the next week. In addition to
identifying 1-3 stocks, usually in pullback to support, to
trade the next day, all front month Puts, available on these
250-350 stocks (more than 1,000) are ranked based on two
criteria: % annual return and % downside risk
protection where the latter is defined as follows:
% Downside Risk Protection =
(Present Price - Put's Strike Price + Put's Premium) /
Current Price
Depending on the time left
to expiration, 5-20 of these options are listed in each
evening's TSM report as potential plays for the next day.
An Example of TSM’s Short-Term Put Writing
Strategy
As an example of writing Puts as an income strategy, consider BIDU, the provider of Chinese and Japanese internet search
services. Its great fundamentals were evidenced by top
rankings from several independent services: Value Line, Zacks, IBD
and Morningstar.
Even so, BIDU had substantial value left at its current
price with 0.65 and 0.75 PEG ratios based on the next two
year’s estimated earnings growth. Moreover, this
year’s earning’s estimates had been increased: upped 29.5
percent over the last 90 days. By all accounts BIDU
was a great stock to trade, one that would have lots of institutional interest
at its major areas of support--our safety net.
As shown in the Chart, May offered several
opportunities to write Puts when, in a volatile market, BIDU’s price
had fallen to major areas of support (blue arrows
marking 5/6, 5/21 and 5/25) following a great earnings
report and gap up on 4/29 (horizontal arrow).
Table I details possible Naked Put trades. For example, on
5/6 BIDU was trading at $62.50 near the support of its
20-day moving average. Its $59 June Put (expiring in 44
days) could be written for $1.90 per share or its $55
strike, with its increased downside protection, at $0.95 a
share. Either strike falls well below BIDU’s 50-day moving
average which is the next likely area of support if price
should continue to fall. That first trade scenario
represented a 28.39 percent annualized return if held to
expiration and an additional 8.64 percent downside
protection from the current price. The second trade
represented a 14.68 percent annualized return with 13.52%
downside protection. Note, I recognize that this trade
doesn't represent the ideal 30 day time frame or 15%
downside protection, but BIDU had such good fundamentals an
exception was made.
Note, the percent annualized return calculations used here
assume that each position would be 100 percent
collateralized as would be required for an IRA account,
e.g., $5,710 ($5,900 - $190) would be frozen in the
brokerage account as collateral for each contract in case a
potential buy was necessary should the BIDU shares actually
be put to the Naked Put writer.
But this trade didn’t need to be held to expiration. Just
seven days later, price rose to $82.29, and the short Put
positions could be closed for $0.40 and $0.25,
respectively. These amounts represented 6.61 and 4.34
percent returns if the position had been held from that
point until expiration 37 days later. Of course, at this
point our cash collateral could be better used
collateralizing a different position.
Short-term BIDU trades presented themselves again on 5/21
and 5/25 and similarly could have been closed shortly
thereafter (each within three days) for substantial gains.
Obviously, in this market, it paid to
manage short Put positions instead of just putting on one
and holding it until expiration. In the BIDU $59 strike
series of trades, we increased our profit from $1.90 per
share to $3.70 ($1.90 – 0.40 + 1.65 – 0.65 + 1.60 – 0.40)
and, at the same time, reduced our exposure to the volatile
market’s risk from 44 to 13 days. That’s a 6.69 percent
return ($370/($5,900-$370)) for each contract (or 187.9
percent annualized) earned on money while one waits for the
next great stock buying opportunity.
Most evenings TSM’s daily report provides a list of Puts
available for TSM stocks that met the 18 percent annualized
return and 15 percent downside protection at the prior day’s
close. These screening criteria lessen as expiration
draws near. Often, the current day’s candidates are provided
intra-day via twitter “tweets” after I personally make the
trade.
Stopping
Losses
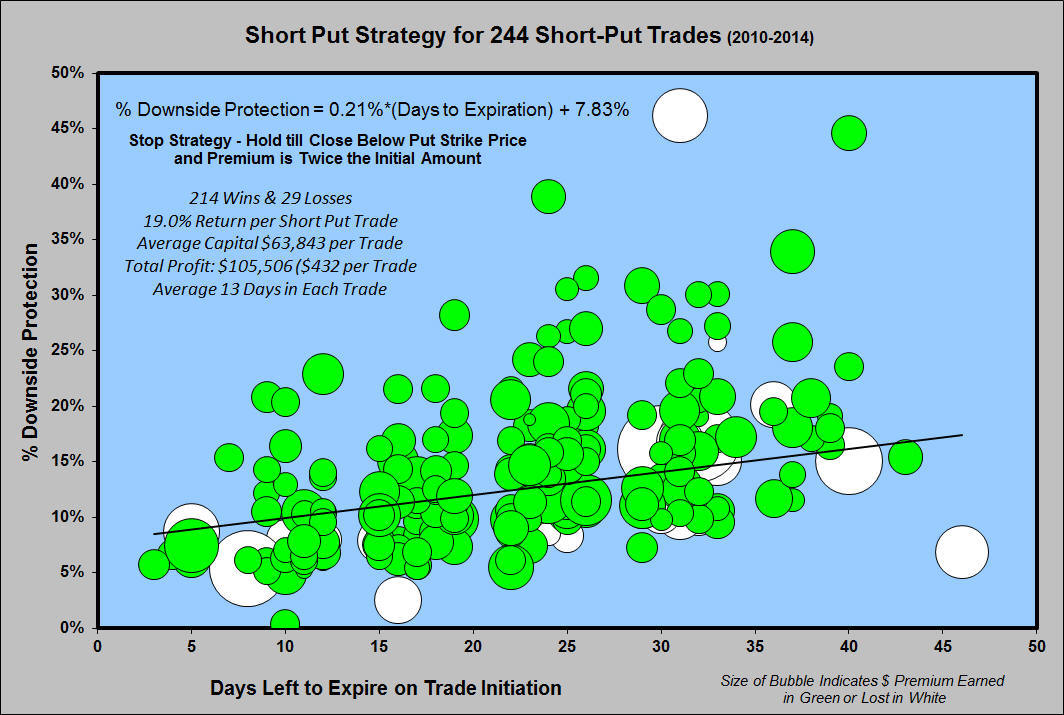
By 9/17/14, 244
Puts had been forecast providing premiums amounting to
$105,506: average profit $432 per trade, average time in
trade 13 days, average annualized return 19% for each and
average cash amount required to back each trade $63,843
(usually 10 contracts were traded).
This plot shows the relationship between days in the trade
and initial % downside protection for these past 244 short
put trades. There were 214 winners (in green) and 29 losers
(in white), and the size of the balloon indicates the size
of the premium captured.
Notice how nearly all these losses could be avoided if these
trades were limited to 27 days or less to expiration.
Its downside protection required as a function of time to
expiration is given by the following regression line:
% Downside Protection = 7.83% + 0.21% x (# of Days to
Expiration)
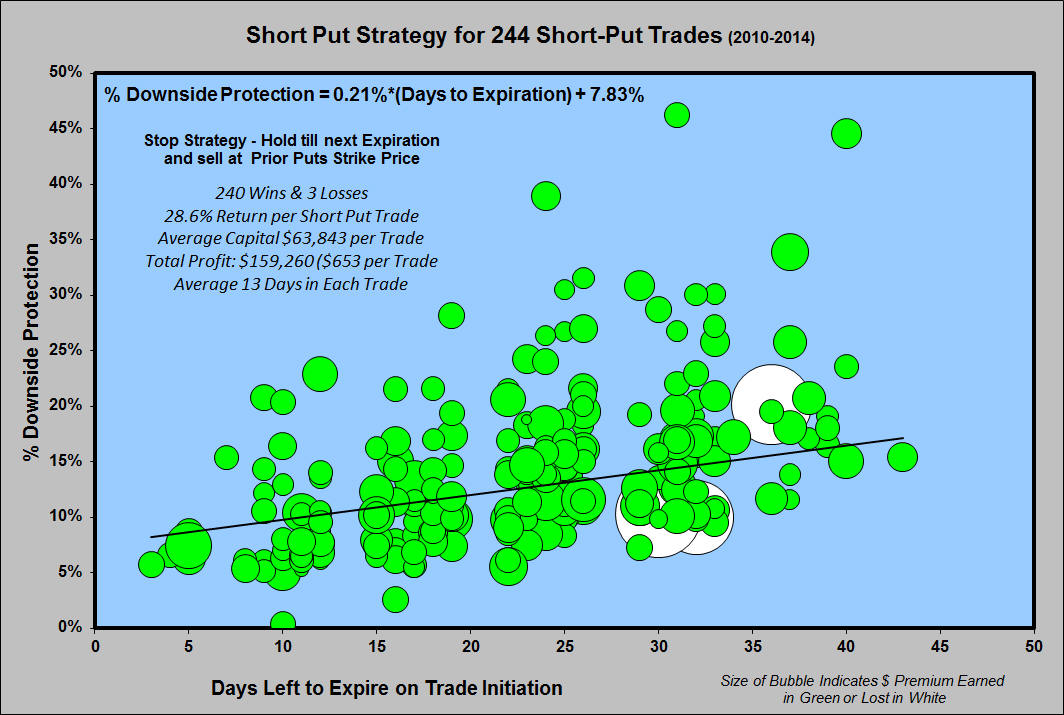
Notice how the profit situation improves to a 98.8% win
rate, as shown in the chart below, when the stop-loss
strategy is changed from immediately selling shares put to
me at a loss to when a losing position puts shares to me, an
immediate sell trade is entered at the Put's strike price
and held there up until the next month's expiration when
either the shares had been sold during this second month for a profit or
at the second expiration closed at a loss. This strategy
reduced the losses to 3 positions and increased the gains to
$159,260. This strategy is ideal for a quality stock.
The real key here is to deal only in quality stocks, i.e.,
those that have institutional support, i.e., a safety net
for our trades. Even so, we will occasionally
encounter a stock (e.g., NUS) that experiences an overnight
big loss that then has to be managed through a repair strategy
that I won't describe here.

Hitwebcounter.com
Richard Miller, Ph.D. - Statistics Professional, is the
president of
TripleScreenMethod.com and
PensacolaProcessOptimizaton.com.
Copyright 2006
TripleScreenMethod.com
It should not be assumed that the methods, techniques, or indicators presented
in these pages will be profitable or that they will not result in losses. Past
results are not necessarily indicative of future results. Examples presented
on these pages are for educational purposes only. These setups are not
solicitations of any order to buy or sell. The author assumes no
responsibility for your trading results. There is a high degree of risk in
trading. I am not recommending that you purchase or short stocks or options
using the techniques and methods presented in this report. Trading should be
based on your personal understanding of market conditions, price patterns, and
risk. I present here information to contribute to your understanding a
technique that has worked well for me.