April, 2008
FEEL FREE TO PRINT THIS REPORT
Fundamentals with Chart Technicals"
Comments or Questions (TSM Service, Methodology, Performance or Your Success Stories) Go Here - (rmiller@triplescreenmethod.com)
- Weekly TSM Qualified Stocks -
|
|
April, 2008 |
|
"An Approach
to Successful Stock Trading Combining Company Fundamentals with Chart Technicals" |
|
|
Comments or Questions (TSM Service, Methodology, Performance or Your Success Stories) Go Here - (rmiller@triplescreenmethod.com) |
|
|
- Weekly TSM Qualified Stocks - |
|
Relationship Between Yesterday's Close and Today's High/Low
| Commodity Channel Index (CCI) | Relative Strength Index (RSI)
AAPL Trading Maxims: 1, 2, 3, 4, 5, 6, 7, 8
Find an example of "Trading the Edge" or "Trading the Wiggles" here.
05/02/08)
Trading Maxim 8 -- Trading the "Wiggles": MOS's above 1-minute chart breaks down the "wiggles" trade: set up (CCI minimum), trigger (1-min bar entirely above 8-period moving average), trade (stay in trade untilentire bar closes above 8-period moving average, then trade as many times as possible buying near the moving average and selling at 25 cent gain (500-1,000 shares),
stop trade when entire bar trades below moving average.
TripleScreenMethod.com
Day Trading AAPL, POT, MON, IBM, RIMM, CF, MOS & APA
(04/29/08)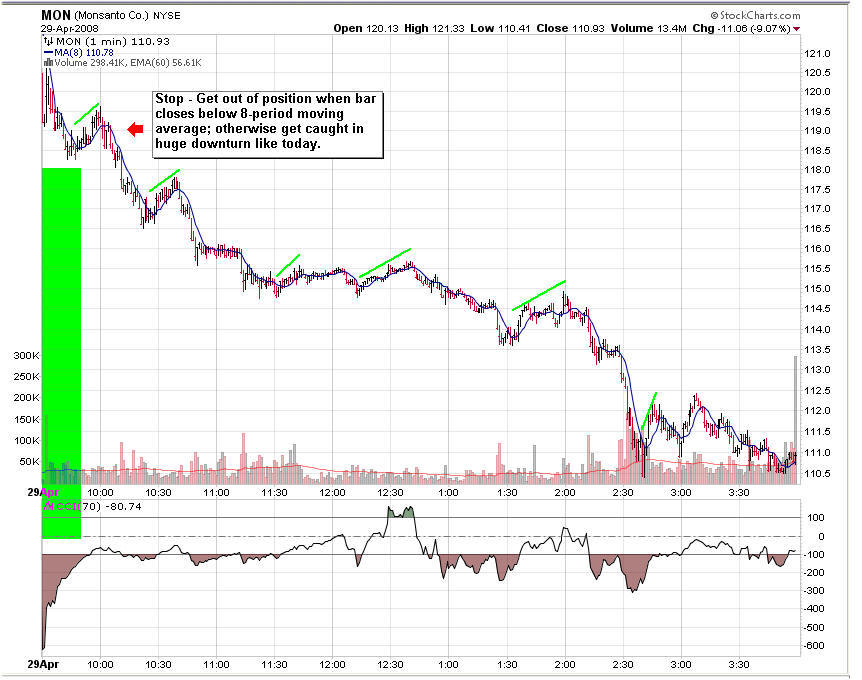
AAPL Day Chart | ,AAPL 1-Min Chart | POT
Day Chart | POT 1-Min Chart|
MON
Day Chart |
MON 1-Min Chart
Many of TSM's high price stocks were diving today. MON is an example
above. It demonstrates the importance of using a stop loss so as not
to ride a stock down. After a CCI minima is made and "wiggles" are
being traded, end the trade sequence--close your long positions-when price
closes below its 8-period moving average (red arrow in chart above).
(04/25/08)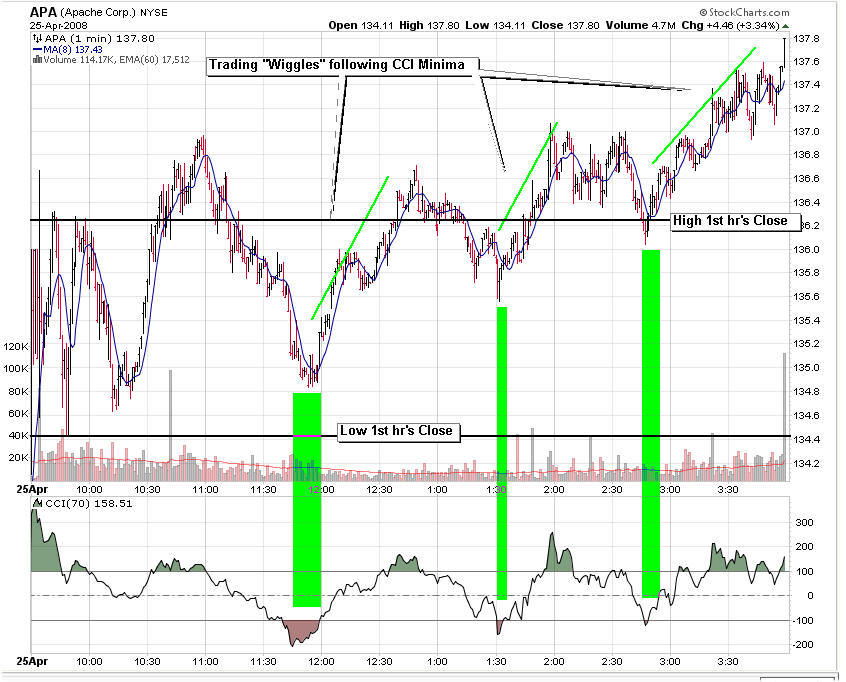
AAPL Day Chart | ,AAPL 1-Min Chart | POT
Day Chart | POT 1-Min Chart|
MON
Day Chart |
MON 1-Min Chart
At present, AAPL's business industry is now being
accumulated by institutions (upper 30%), same for RIMM (lower 23%), while
POT (upper 1%), MON
(upper 5%), IBM (upper 25%), MOS (upper 5%), CF (upper 5%) and APA (upper
4%) are. Today APA produced three good day-trading entries: all following the CCI minimum
(green lines). Today's highs and lows relative to yesterday's close: AAPL
$2.16 higher and -$2.54 lower, POT +$13.12 higher and -$0.64 lower, MON
$6.58 higher and +$0.75 higher, APA +$4.46 higher and
+$0.77 higher, MOS +$10.54 higher and +$0.62 higher an CF +$7.37 higher and
-$7.11 lower.
(04/24/08)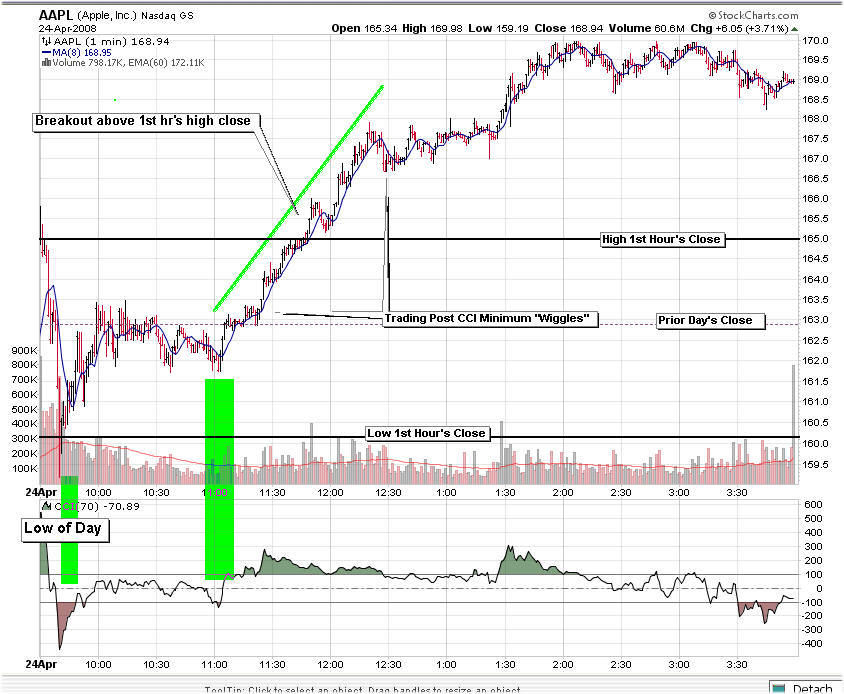
AAPL Day Chart | ,AAPL 1-Min Chart | POT
Day Chart | POT 1-Min Chart|
MON
Day Chart |
MON 1-Min Chart
At present, AAPL's business industry is not being
accumulated by institutions (lower 11%), same for RIMM (lower 23%), while
POT (upper 1%), MON
(upper 4%), IBM (upper 22%), MOS (upper 4%), CF (upper 4%) and APA (upper
6%) are. Today AAPL produced two good day-trading entries: one following the CCI minimum
(green line) and the other following the breakout from the 1st hour's high
close. Today's highs and lows relative to yesterday's close: AAPL
$7.09 higher and -$3.70 lower, POT +$2.63 higher and -$16.38 lower, MON
$0.32 higher and -$7.48 lower, APA -$0.94 lower and
-$5.89 lower, MOS +$0.97 higher and -$12.15 lower an CF +$0.91 higher and
-$12.92 lower.
(04/23/08)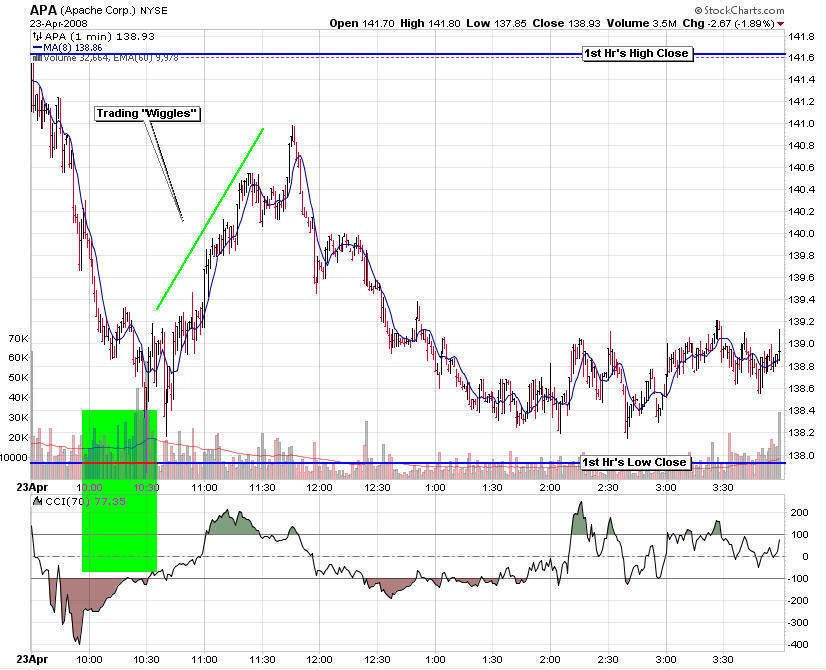
AAPL Day Chart | ,AAPL 1-Min Chart | POT
Day Chart | POT 1-Min Chart|
MON
Day Chart |
MON 1-Min Chart
At present, AAPL's business industry is not being
accumulated by institutions (lower 11%), same for RIMM (lower 23%), while
POT (upper 1%), MON
(upper 4%), IBM (upper 22%), MOS (upper 4%), CF (upper 4%) and APA (upper
6%) are. Today APA produced one good day-trading opportunities following the CCI minimum
(green line). Today's highs and lows relative to yesterday's close: AAPL
$4.64 higher and $0.88 higher, POT +$1.14 higher and -$12.73 lower, MON
$1.18 higher and -$4.44 lower and APA $0.20 higher and
-$3.75 lower.
(04/22/08)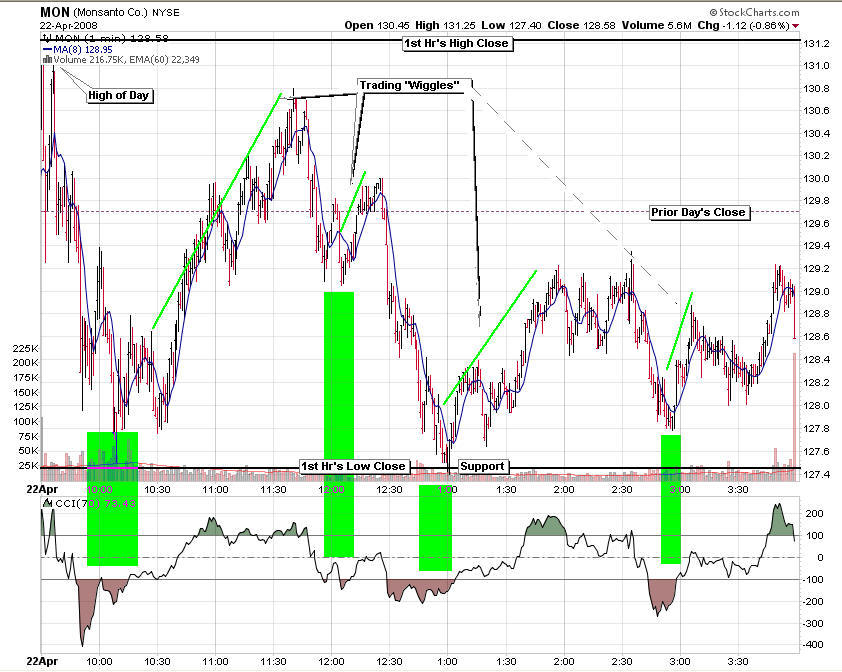
AAPL Day Chart | ,AAPL 1-Min Chart | POT
Day Chart | POT 1-Min Chart|
MON
Day Chart |
MON 1-Min Chart
At present, AAPL's business industry is not being
accumulated by institutions (lower 11%), same for RIMM (lower 23%), while
POT (upper 1%), MON
(upper 4%), IBM (upper 22%), MOS (upper 4%), CF (upper 4%) and APA (upper
6%) are. Today, as MON produced several day-trading opportunities following the CCI minimum
(green lines). Today's highs and lows relative to yesterday's close: AAPL
-$0.16 lower and -$10.07 lower, POT +$6.05 higher and -$2.08 lower, MON
$1.55 higher and -$2.30 lower and APA $1.84 higher and -$0.60 lower.
(04/21/08)
AAPL Day Chart | ,AAPL 1-Min Chart | POT
Day Chart | POT 1-Min Chart|
MON
Day Chart |
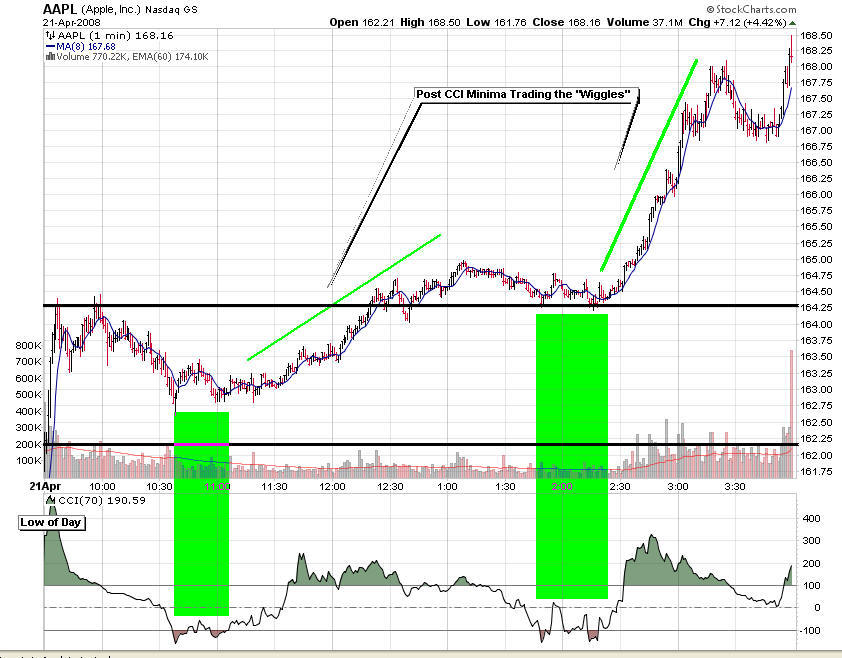
At present, AAPL's business industry is not being
accumulated by institutions (lower 11%), same for RIMM (lower 23%), while
POT (upper 1%), MON
(upper 4%), IBM (upper 22%), MOS (upper 4%), CF (upper 4%) and APA (upper
6%) are. Today, as AAPL rises to its earnings report (after close
Wednesday 4/23) produced two day-trading opportunities following the CCI minimum
(green line). Today's highs and lows relative to yesterday's close: AAPL
$7.46 higher and $0.72 higher, POT +$5.28 higher and -$0.76 lower, MON
$1.70 higher and -$3.05 lower and APA $2.16 higher and -$2.77 lower.
(04/18/08)
AAPL Day Chart | ,AAPL 1-Min Chart | POT
Day Chart | POT 1-Min Chart|
MON
Day Chart |
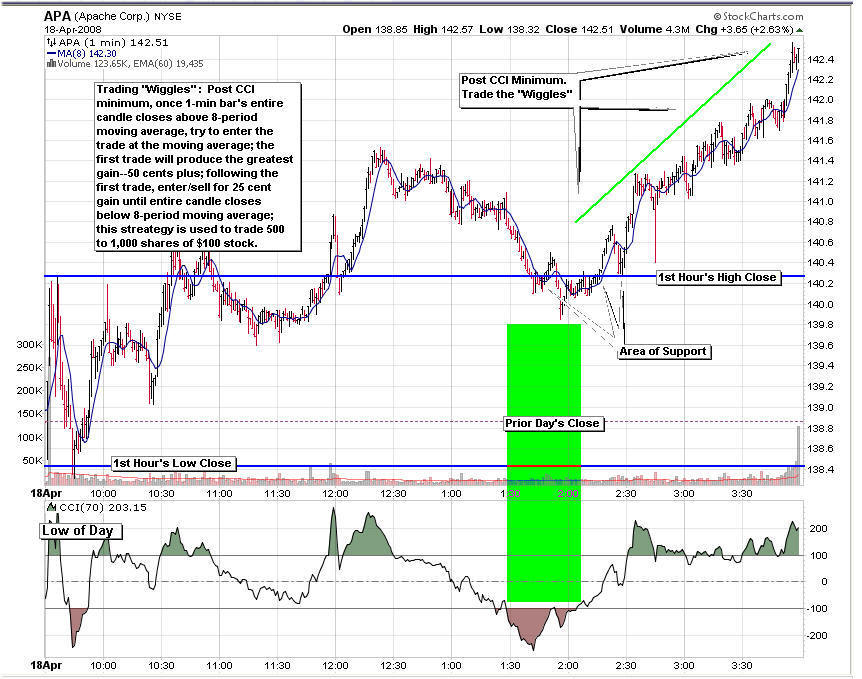
At present, AAPL's business industry is not being
accumulated by institutions (lower 11%), same for RIMM (lower 23%), while
POT (upper 1%), MON
(upper 4%), IBM (upper 22%), MOS (upper 4%), CF (upper 4%) and APA (upper
6%) are. Today, APA produced a late day trading opportunity for two
hours
following the CCI minimum
(green line). Today's highs and lows relative to yesterday's close: AAPL
$7.77 higher and $3.96 higher, POT +$10.12 higher and -$1.85 lower, MON
$4.02 higher and -$1.23 lower and APA $3.54 higher and -$0.69 lower.
(04/17/08)
AAPL Day Chart | ,AAPL 1-Min Chart | POT
Day Chart | POT 1-Min Chart|
MON
Day Chart |

At present, AAPL's business sector is not being
accumulated by institutions (lower 9%), while both POT (upper 1%) and MON
(upper 7%) are. Today, MON several trading opportunities
following the CCI minimum
(green line). Today's highs and lows relative to yesterday's close: AAPL
$2.30 higher and -$0.35 lower, POT +$1.63 higher and -$8.11 lower and MON
$0.46 higher and -$6.16 lower.
(04/16/08)
AAPL Day Chart | ,AAPL 1-Min Chart | POT
Day Chart | POT 1-Min Chart|
MON
Day Chart |
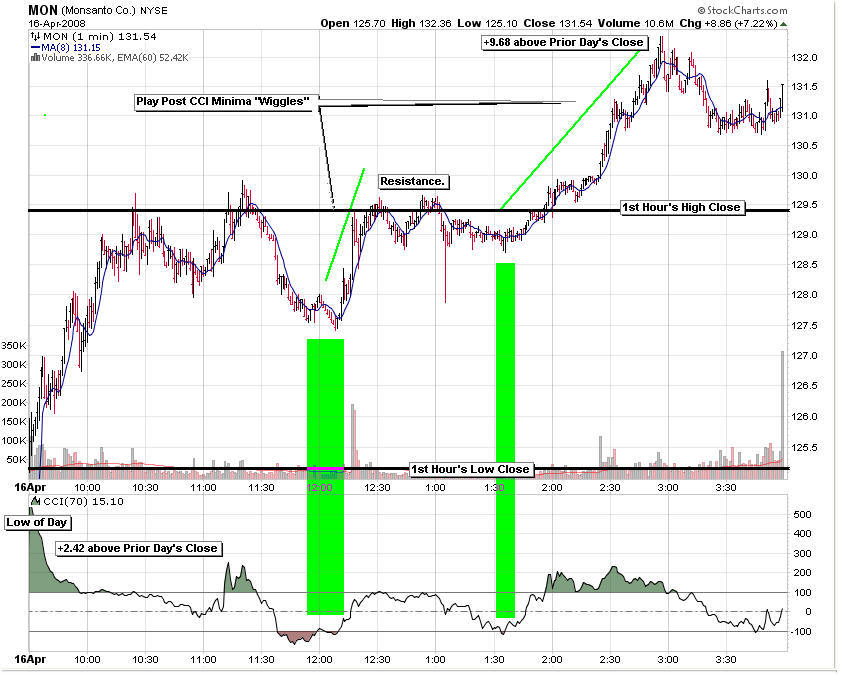
The market bounced today. At present, AAPL's business sector is not being
accumulated by institutions (lower 9%), while both POT (upper 1%) and MON
(upper 7%) are. Today, MON provided an excellent trading opportunities ollowing the CCI minimum
(green line). Today's highs and lows relative to yesterday's close: AAPL
$6.02 higher and +$2.24 higher, POT +$14.64 higher and +$6.69 higher and MON
$9.68 higher and +$2.42 higher.
(04/15/08)
AAPL Day Chart | ,AAPL 1-Min Chart | POT
Day Chart | POT 1-Min Chart|
MON
Day Chart |
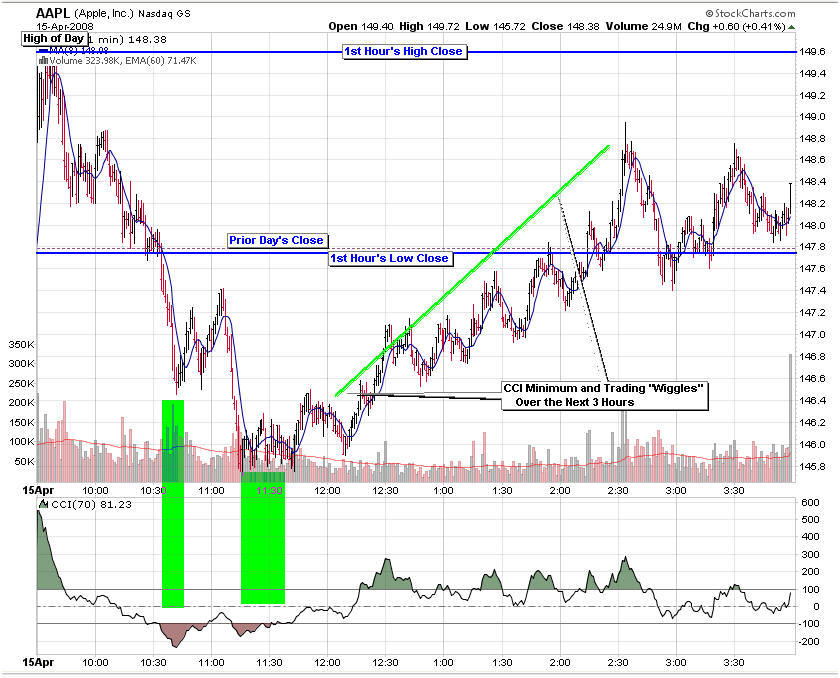
The market's ready for a short-term bounce, and lots of potential longs are
setting up. At present, AAPL's business sector is not being
accumulated by institutions (lower 9%), while both POT (upper 1%) and MON
(upper 7%) are. Today, AAPL provided an excellent trading opportunity
following the CCI minimum
(green line). Today's highs and lows relative to yesterday's close: AAPL
$1.94 higher and -$2.06 lower, POT +$3.59 higher and -$0.30 lowerer and MON
$1.89 higher and -$2.13 lower.
(04/14/08)
AAPL Day Chart | ,AAPL 1-Min Chart | POT
Day Chart | POT 1-Min Chart|
MON
Day Chart |

At present, AAPL's business sector is not being accumulated by institutions
(lower 9%), while both POT (upper 1%) and MON (upper 7%) are. Today,
MON provided several periods of opportunity following each CCI minimum
(green lines). Today's highs and lows relative to yesterday's close: AAPL
$2.11 higher and -$2.60 lower, POT +$5.95 higher and $1.86 higher and MON
$3.89 higher and -$0.23 lower.
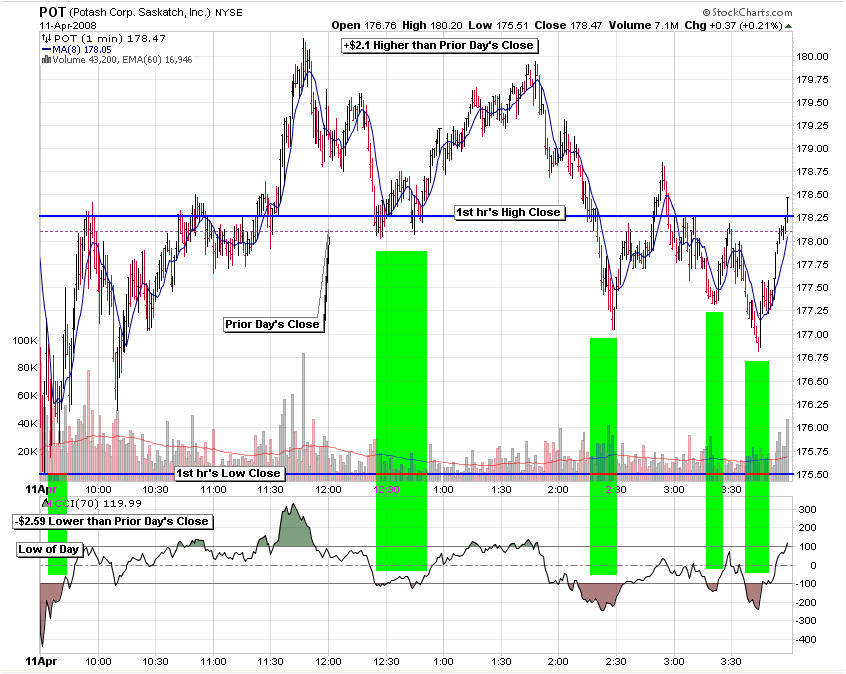
(04/11/08)
AAPL Day Chart | ,AAPL 1-Min Chart | POT Day Chart | POT 1-Min Chart| MON Day Chart |
MON 1-Min ChartAt present, AAPL' business sector is not being accumulated by institutions (lower 9%), while both POT (upper 1%) and MON (upper 7%) are. Today, POT provided several periods of opportunity following each CCI minimum. Today's highs and lows relative to yesterday's close: AAPL -$1.25 lower and -$8.15 lower, POT +$2.10 higher and -$2.59 lower and MON $3.69 higher and -$1.53 lower.
(04/10/08)
AAPL Day Chart | ,AAPL 1-Min Chart | POT
Day Chart | POT 1-Min Chart|
MON
Day Chart |
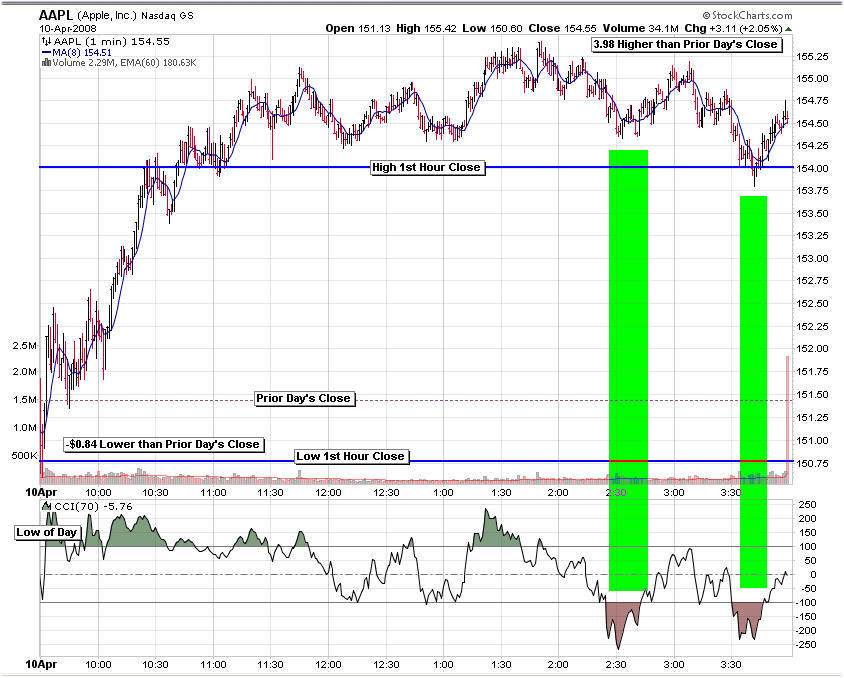
At present, AAPL' business sector is not being accumulated by institutions
(lower 9%), while both POT (upper 1%) and MON (upper 7%) are. APPL
provided short periods of opportunity following each CCI minimum.
Note, on the daily chart that AAPL has pulled back to the support of its
rising 200-day moving average. Remember, too, AAPL reports earnings
after the close on 4/23. It should generally rise into the close --
another edge. Today's highs and lows relative to yesterday's close:
AAPL -$0.84 lower and $3.98 higher, POT -$2.64 lower and $2.58 higher, MON
-$1.77 lower and $1.59 higher,.
Obviously, days like we're seeing over the past trading week, it would
pay to buy the close and look to sell a dollar higher the next day.
(04/09/08)
AAPL Day Chart | ,AAPL 1-Min Chart | POT
Day Chart | POT 1-Min Chart|
MON
Day Chart |
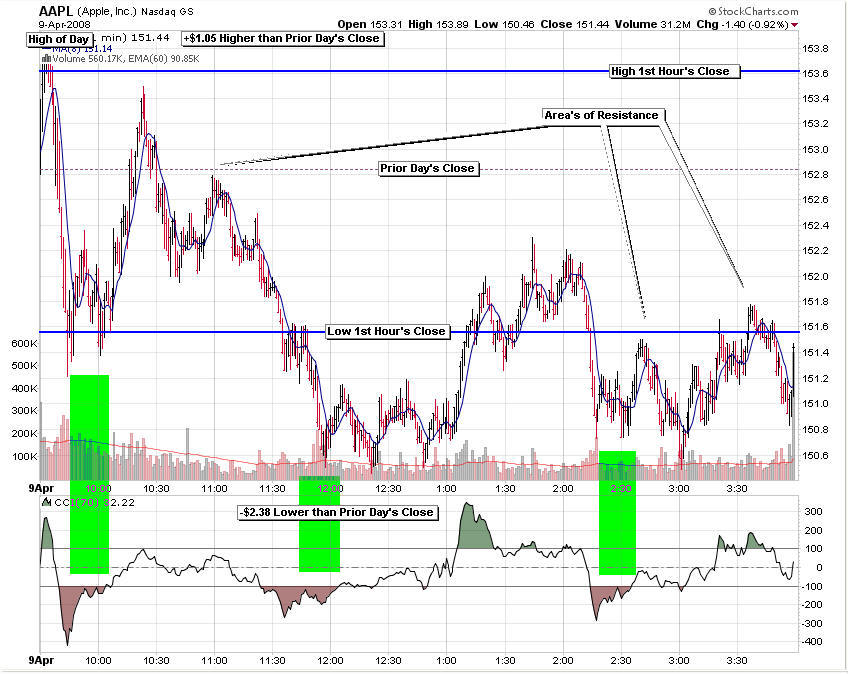
At present, AAPL' business sector is not being accumulated by institutions
(lower 9%), while both POT (upper 1%) and MON (upper 7%) are. APPL
provided short periods of opportunity following each CCI minimum.
Note, on the daily chart that AAPL has pulled back to the support of its
rising 200-day moving average. Remember, too, AAPL reports earnings
after the close on 4/23. It should generally rise into the close --
another edge. Today's highs and lows relative to yesterday's close:
AAPL -$2.38 lower and $1.05 higher, POT -$2.32 lower and $3.14 higher, MON
-$1.68 lower and $2.13 higher,.
Obviously, days like we're seeing over the past trading week, it would
pay to buy the close and look to sell a dollar higher the next day.
(04/08/08)
AAPL Day Chart | ,AAPL 1-Min Chart | POT
Day Chart | POT 1-Min Chart|
MON
Day Chart |
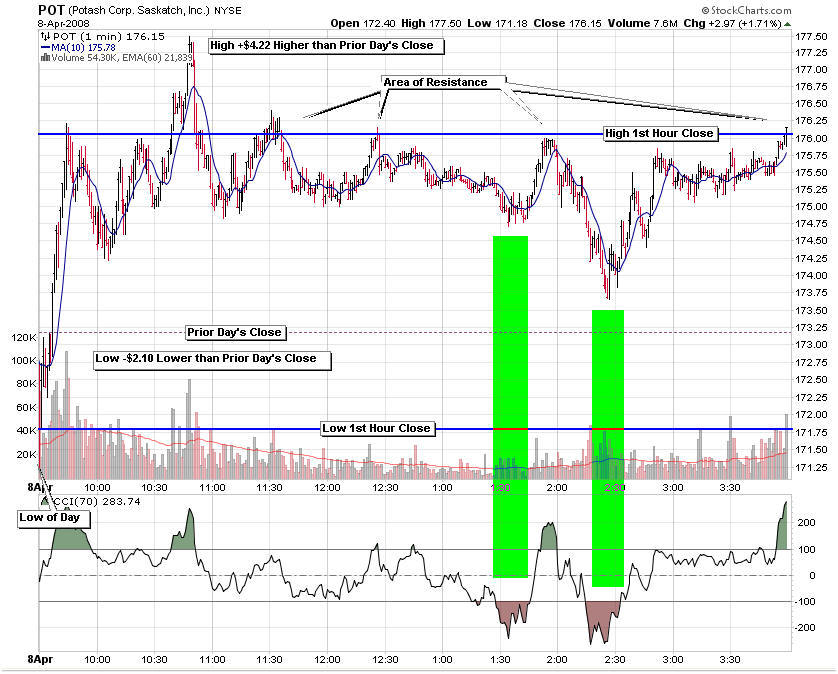
At present, AAPL' business sector is not being accumulated by institutions (lower
9%), while
both POT (upper 1%) and MON (upper 7%) are. POT moved higher from the
start, making the low of the day in the first few minutes of trading before
moving sideways the rest of the day. The two post-CCI minima
periods provided some opportunity for short-term trades. Note how
the first hour's high close provided resistance throughout the day.
Today's low for POT fell -$2.10 lower than yesterday's close and its high
$4.22 higher.
Obviously, days like we're seeing over the past trading week, it would
pay to buy the close and look to sell a few dollars higher the next day.
The daily chart looks a little overbought now and ready to pullback.
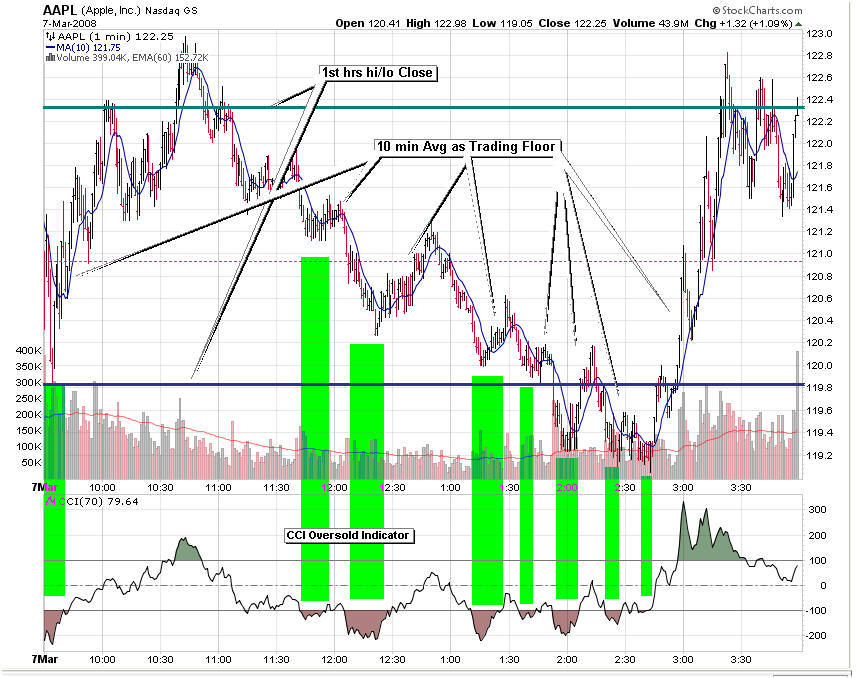
(04/07/08)
AAPL Day Chart | ,AAPL 1-Min Chart | POT
Day Chart | POT 1-Min Chart|
MON
Day Chart |
MON 1-Min Chart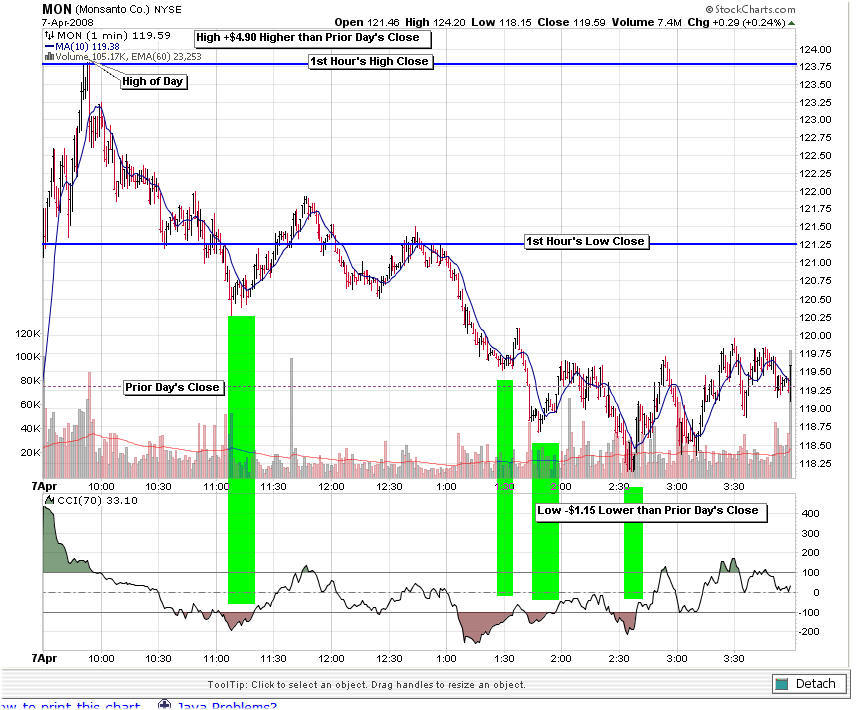
At present, AAPL' business sector is not being accumulated by institutions (lower
9%), while
both POT (upper 1%) and MON (upper 7%) are. As shown in the plot above, post-CCI minima
continue provided some opportunity for short-term trades. Today's
low for MON fell -$1.15 lower than yesterday's close and its high $4.90 higher.
MON gapped open then quickly fell through most of the day.
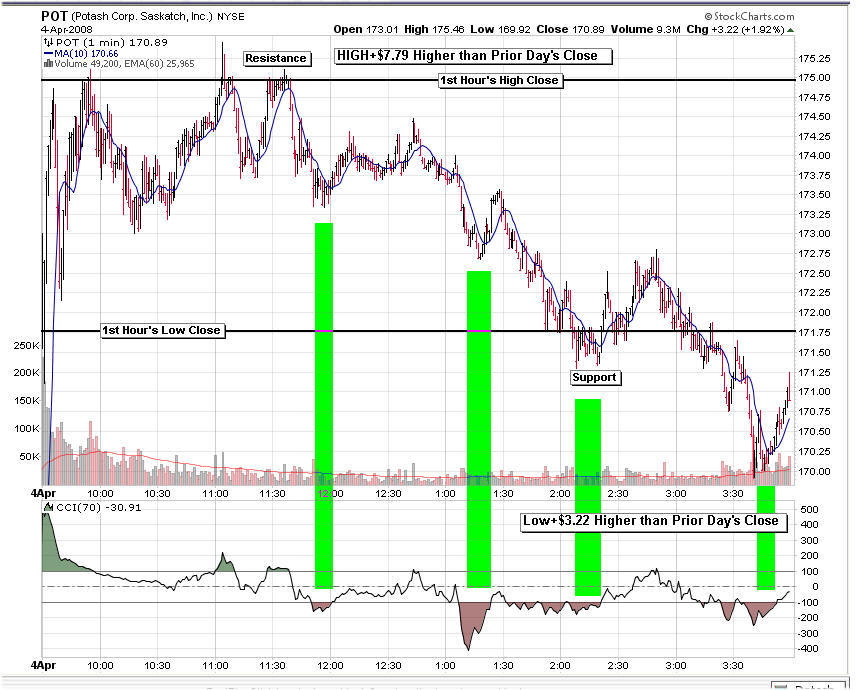
(04/04/08)
AAPL Day Chart | ,AAPL 1-Min Chart | POT
Day Chart | POT 1-Min Chart
AAPL Trading Maxim (7):�Significant
bullish runs will often follow CCI minima. These runs will reverse
(pullback) to regular depths called Fibonacci ratios. The most likely are
38, 50 and 62 percent.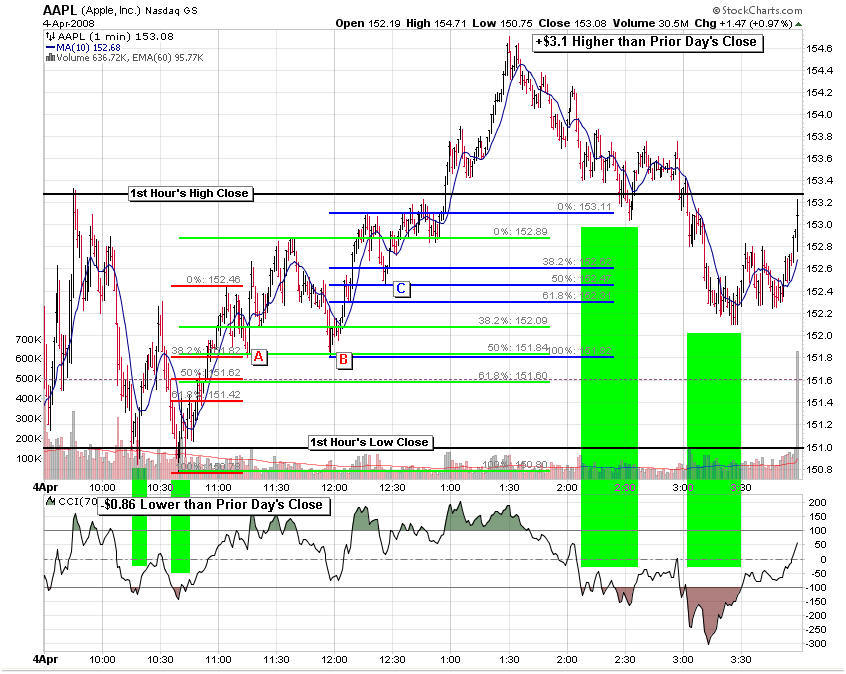
At present, AAPL' business sector is not being accumulated by institutions (lower
9%), while
POT is (upper 1%). As shown in the two plots above, post-CCI minima
continue to provide many opportunities for short-term trades. Today's
low for POT fell +$3.22 higher than yesterday's close and its high $7.79 higher. POT gapped open then pulled back during
the day, while AAPL ran higher into the midday then reversed down
into the close. One important feature of day trading is to
identify potential areas of resistance and support (that's what the
prior day's close and 1st hour high and low closes offer).
Additionally, following a CCI minimum, the next bullish run will
feature regular pullbacks as traders take profits. And these
pullbacks will most often reverse at regular depths (common
Fibonacci percentages). In AAPL's chart above, areas A, B and
C are the 38, 50 and 50% Fibonacci ratios of their respective
bullish runs.
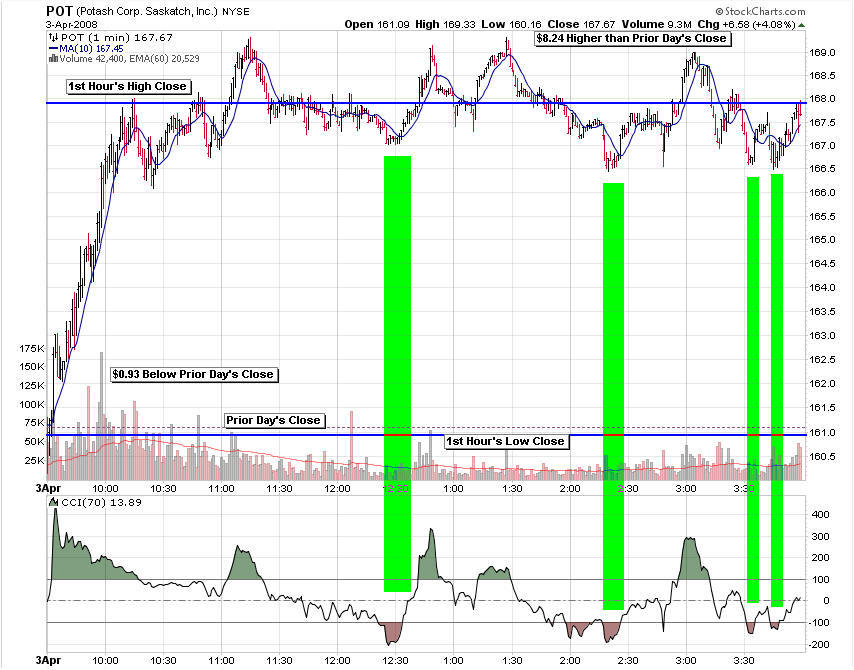
(04/03/08)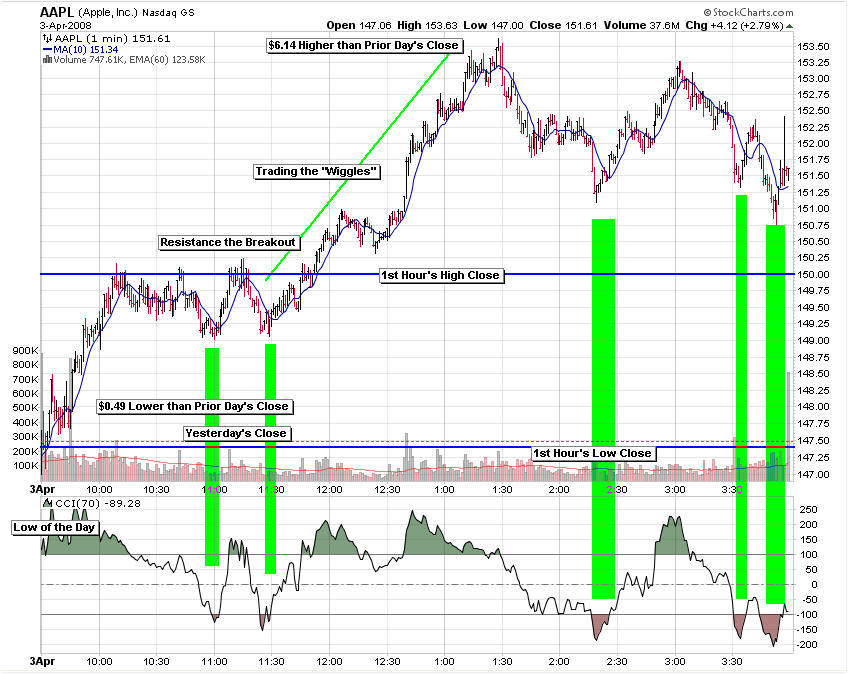
At present, AAPL is not being accumulated by institutions (lower 11%), while
POT is (upper 1%). Further, POT is trading more than 5 million shares
daily, trading over > $3 range (>$8 today), price more than $100 per share,
and is a stock with great fundamentals. Post-CCI minima continue to
provide many opportunities for short-term trades. Today's low for POT fell
+$0.93 lower than yesterday's close and its high $48.24 higher. POT
made its bullish run at the open, while AAPL took a little longer.
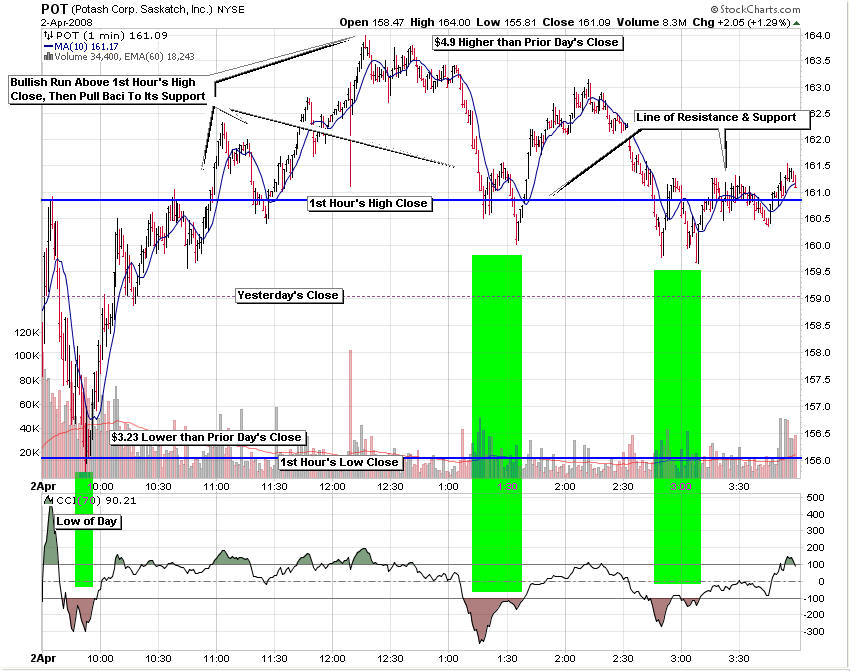
(04/02/08)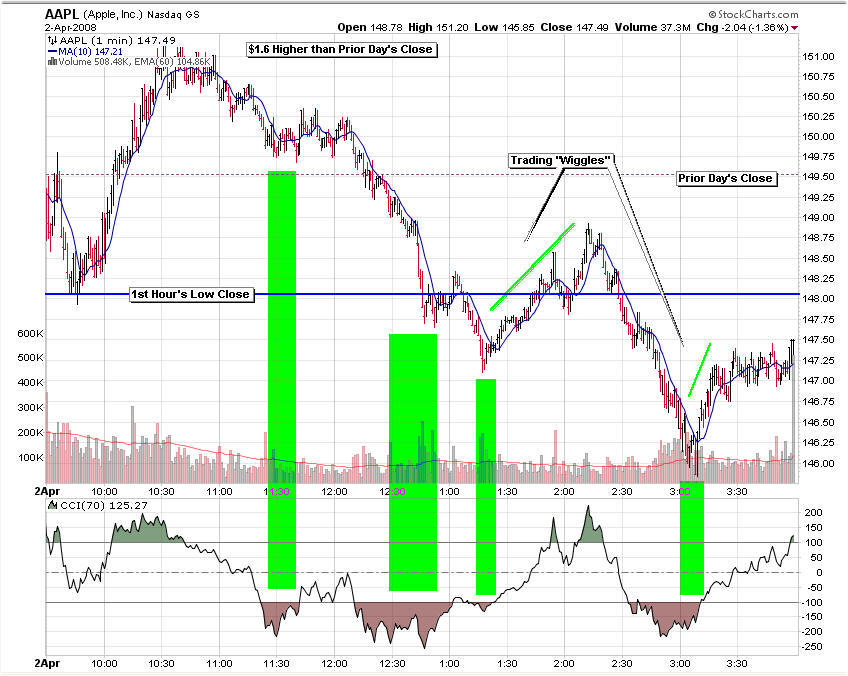
At present, AAPL is not being accumulated by institutions (lower 11%), while
POT is (upper 1%). Further, POT is trading more than 5 million shares
daily, trading over > $3 range (>$8 today), price more than $100 per share,
and is a stock with great fundamentals. Notice the difference in the
intra-day patterns for these two stocks. Post-CCI minima continue to
provide many opportunities for short-term trades. Today's low for POT fell
+$3.23 lower than yesterday's close and its high $4.90 higher.
(04/01/08)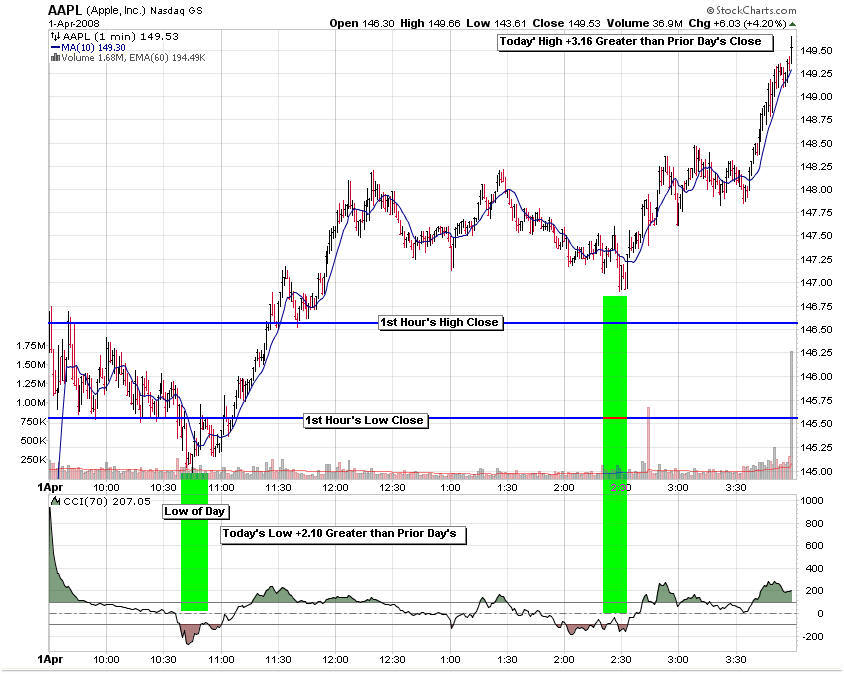
AAPL
gapped up at the open, made its low of the day in the morning, moved higher
until noon, moved sideways for most of the rest of the day then rose into
the close. Both CCI minima marked in green provided a nice series of trades ("wiggles") over the
following hour or so. Today's low fell +$2.10 higher than yesterday's close
and its high $3.16 higher. The daily chart shows that AAPL has closed
its Jan gap but now lies just under the resistance of its 200-day moving
average. I still think that AAPL wants to rise into its
earnings report due out Wednesday 4/23/08 after the close.
(03/31/08)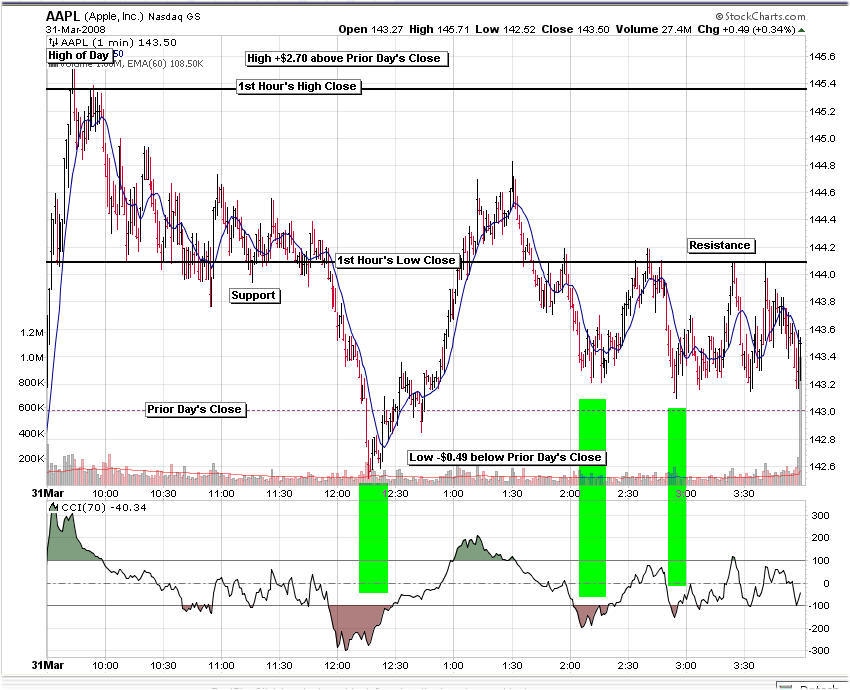
AAPL
made its high of the day in the first half hour then turned down until noon. The first CCI minima provided a nice series of trades ("wiggles") over the
hour or so. Once again, the 1st hour's high close provided both resistance
and support the rest of the day. Today's low fell -$0.49 lower than
yesterday's close and its high $2.70 higher. The daily chart continues indecisive
but its late day selling pressure looks like
it wants to fall further--perhaps to its falling 50-day moving average.
Again, volume was very light. I still think that AAPL wants to rise into its
earnings report due out Wednesday 4/23/08 after the close.
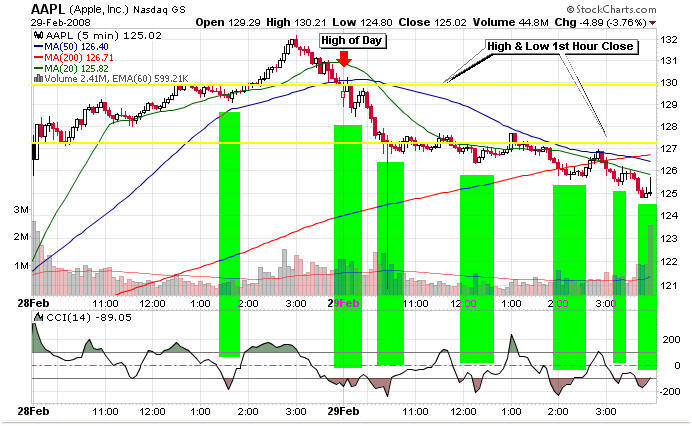
(03/28/08)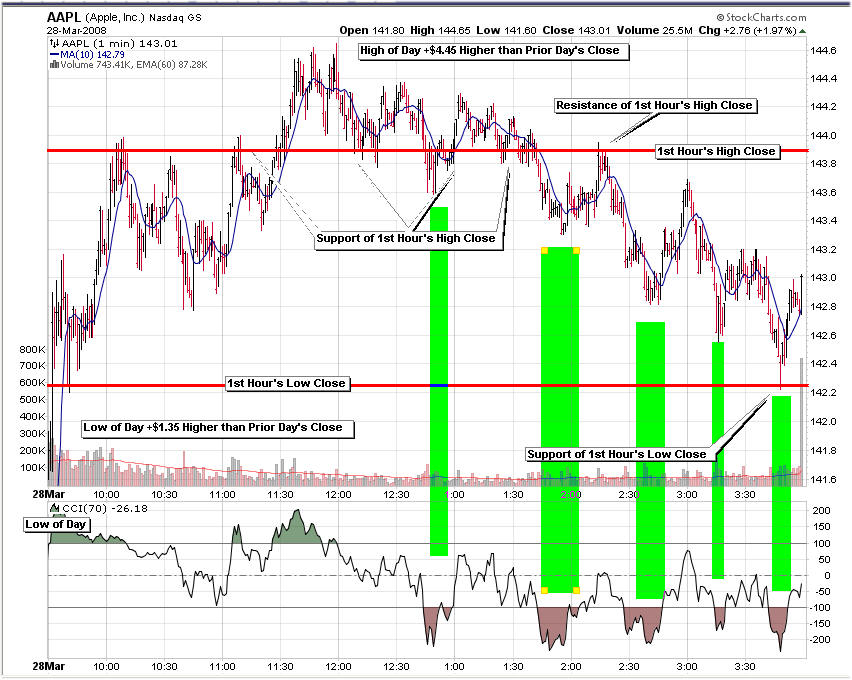
AAPL
gapped open above yesterday's close then moved higher until noon.
After that saw-toothed down for the rest of the day. There were five CCI minima that could have been
traded carefully. Notice how the 1st hour's high close offered both
regions of support and resistance, and the 1st hour's low a late day target.
It certainly pays to know where these lines are. Today's low fell +$1.35
higher than yesterday's
close and its high $4.45 higher. The daily chart continues indecisive
but its late day selling pressure looks like
it wants to fall further--perhaps to its falling 50-day moving average.
Again, volume was very light. I think that AAPL wants to rise into its
earnings report due out Wednesday 4/23/08 after the close.
(03/27/08)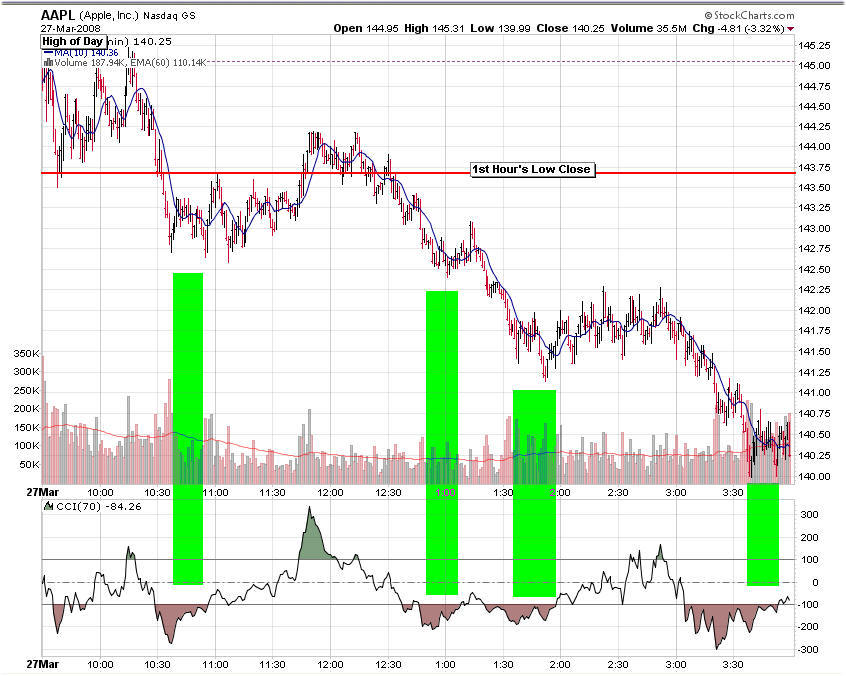
AAPL
after three days of making the low of the day in the first few minutes, the
tide reversed today. There were four CCI minima that could have been
traded carefully, but after closing below its 1st hour low close, the move
was down for most of the day. Today's low fell -$5.06 below yesterday's
close and its high $0.25 higher. The daily chart continues now looks like
it wants to fall further--perhaps to its falling 50-day moving average.
Again, volume was light. I think that AAPL wants to rise into its
earnings report due out Wednesday 4/23/08 after the close.
(03/26/08)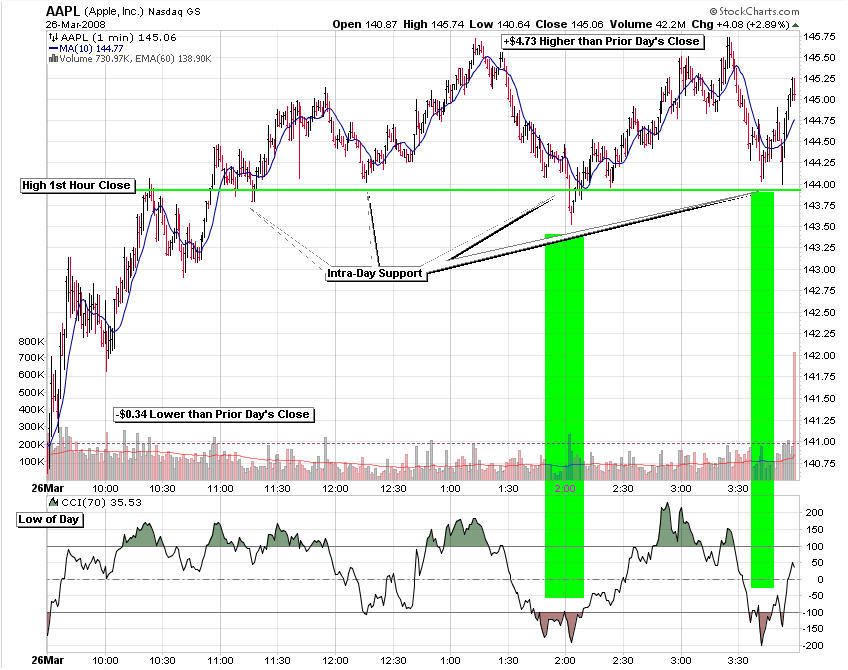
AAPL
for the 3rd day in a row
made the low of the day in the first few minutes, moved higher for most of
the day,
and then traded sideways.
There were two CCI minima that could have been traded with "wiggles" and a
breakout above the 1st hour's high close. Notice how the 1st hour's
high close provided support several times during the day. Today's low
fell -$0.34 below yesterday's close and its high $4.73 higher. The daily chart continues to look bullish
as it readies to meet its rising 200-day moving average. Again, it would be nice to
see volume pick up a bit. It's starting to fill the gap formed in late
January. I decided to buy five $130 April Calls for $16.75 a share (AAPL
closed at $143.70) {Calls expire in 22 days}. I'll look to make ~$1
tomorrow.
(03/25/08)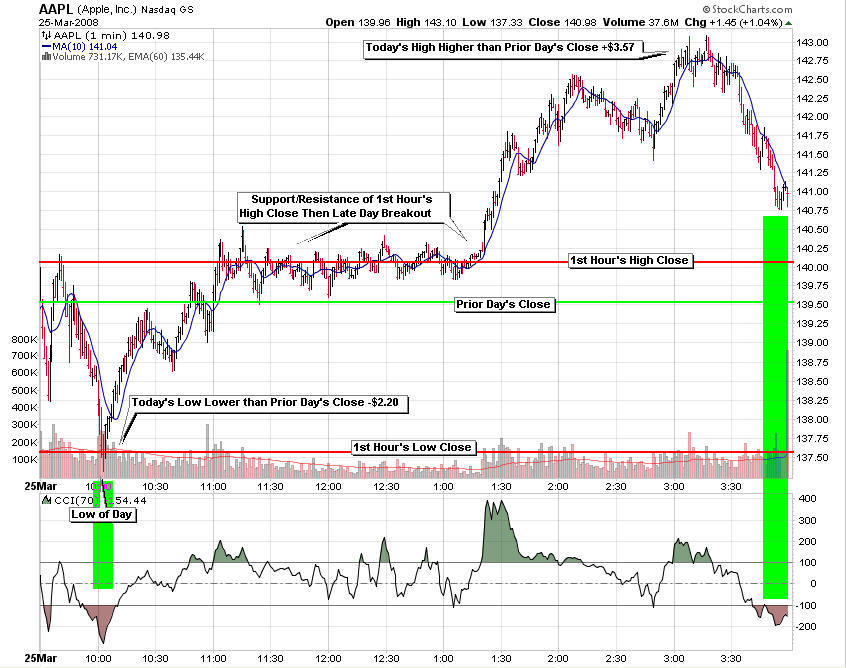
AAPL
again
made the low of the day in the first few minutes, moved higher from there,
and then fell a bit in the last hour.
Starting ~13:15, breakout above the 1st hour's high close would have been an
excellent long trade for the day. Notice how the 1st hour's high close provided support
and resistance during the early part of the day. Today's low fell
-$2.20 below yesterday's close and its high $3.57 higher. The daily chart continues to look bullish
as it now readies to meet its rising 200-day moving average. Again, it would be nice to
see volume pick up a bit.
(03/24/08)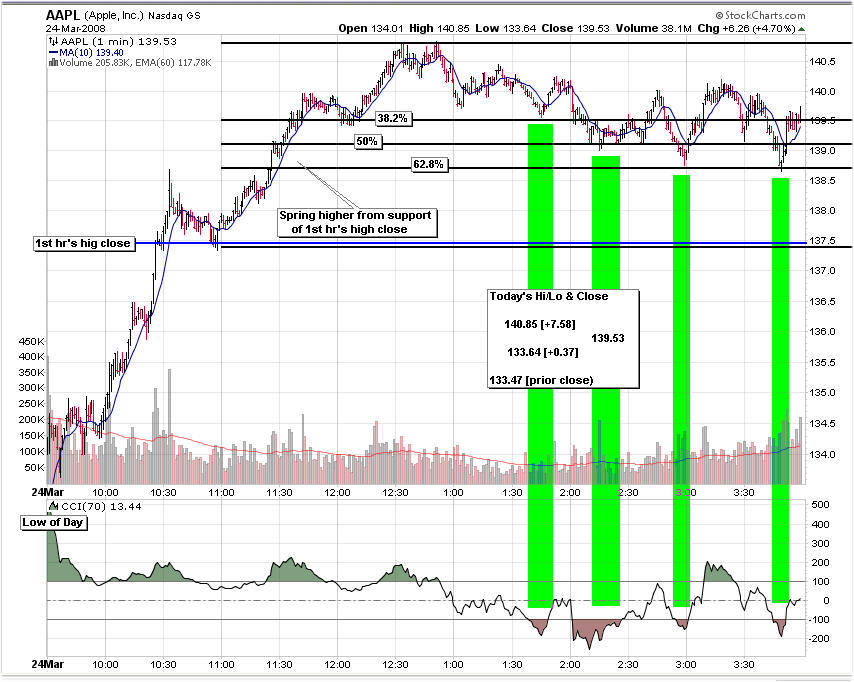
AAPL
made the low of the day in the first few minutes then moved much from there.
Starting ~12:00, there were a few chances to trade "wiggles"
following CCI minimum, but the major trade would have been above the 1st
hour's close. Notice how the 1st hour's high close provided support at
its first test and how the Fib ratios formed from the first half day climb
provided support during the second half of the day. Today's low fell
$0.37 above yesterday's close and its high $7.58 higher. The daily chart continues to look bullish
as it now readies to meet its rising 200-day moving average. Again, it would be nice to
see volume pick up a bit.

(03/20/08)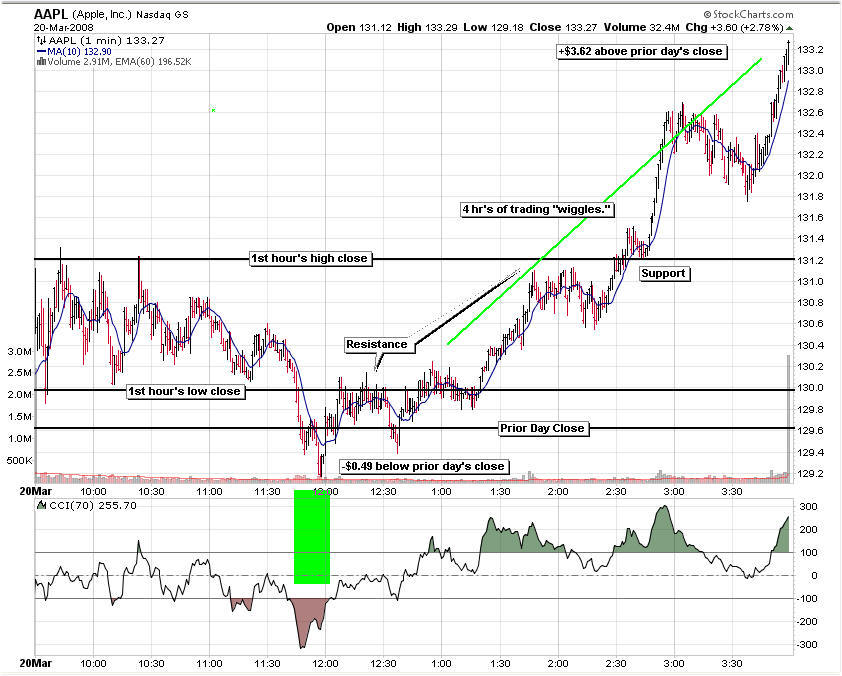
AAPL
made the high of the day at the end of the
day. Starting ~12:00, there was a four hour chance to trade the "wiggles"
following CCI minimum. Today's low fell $0.49 below yesterday's close
and its high $3.62 higher. The daily chart continues to look bullish
as it readies to meet its falling 50-day moving average. It would be nice to
see volume pick up a bit.
(03/19/08)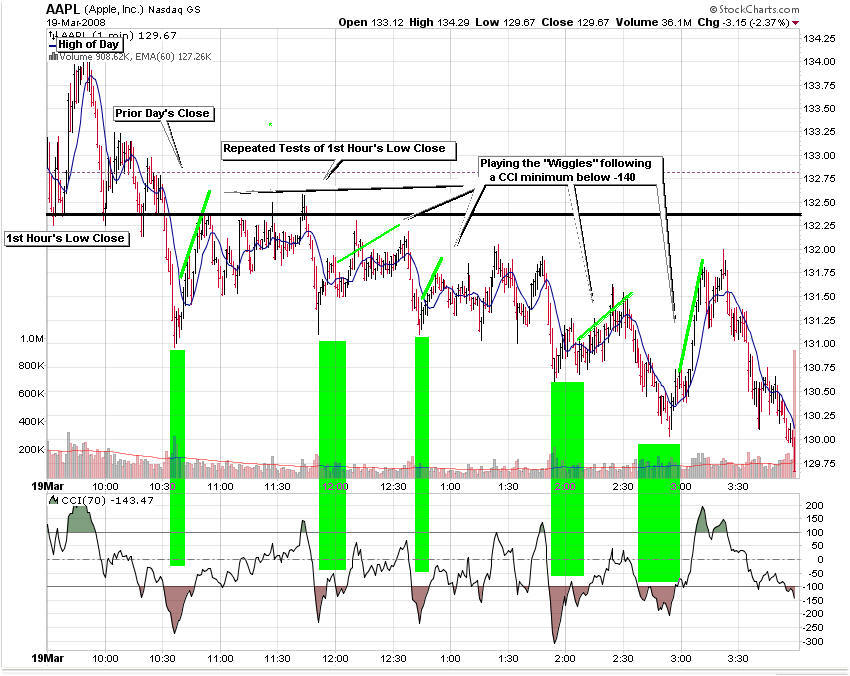
AAPL
made the high of the day in the 1st half hour then fell for the rest of the
day. There were, however, several chances to trade the "wiggles"
following CCI minima. Today's low fell $3.14 below
yesterday's close and its high $1.47 higher. The daily chart shows AAPL
looks bearish for tomorrow.
(03/18/08)
AAPL Trading Maxim (6):�The
the high and low close made in the first hour act as areas of
support and resistance, especially the first test.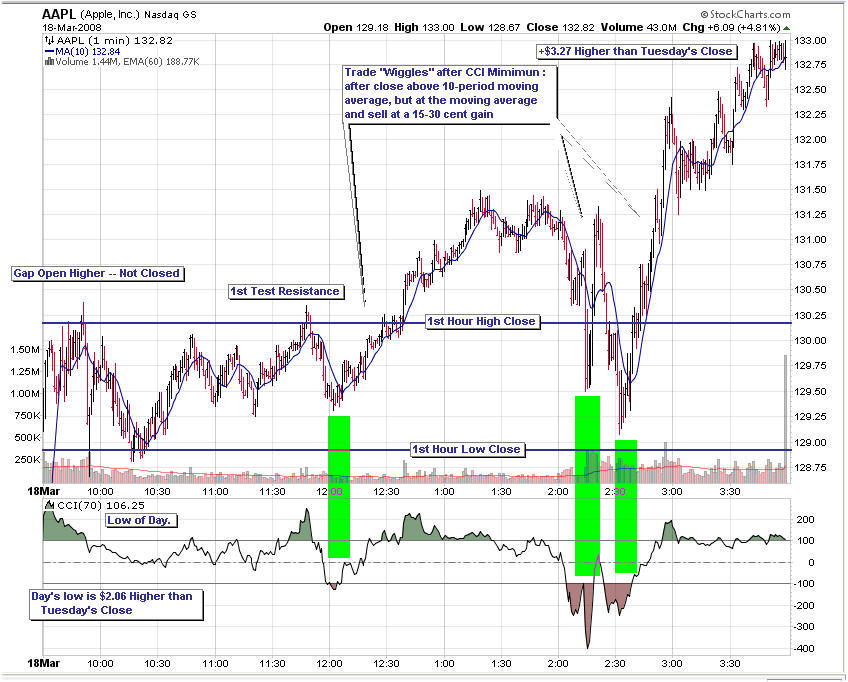
AAPL
gaped open higher and failed to close during the day--a relatively
rare event possibly indicative of a change in AAPL trading behavior
(only time will tell). Two of three post CCI minima created
great
"Wiggle" trading zones. Today's low fell $2.06 higher than
yesterday's close and its high $3.27 higher. The daily chart shows AAPL
looks bullish though I would like to see more volume.
(03/17/08)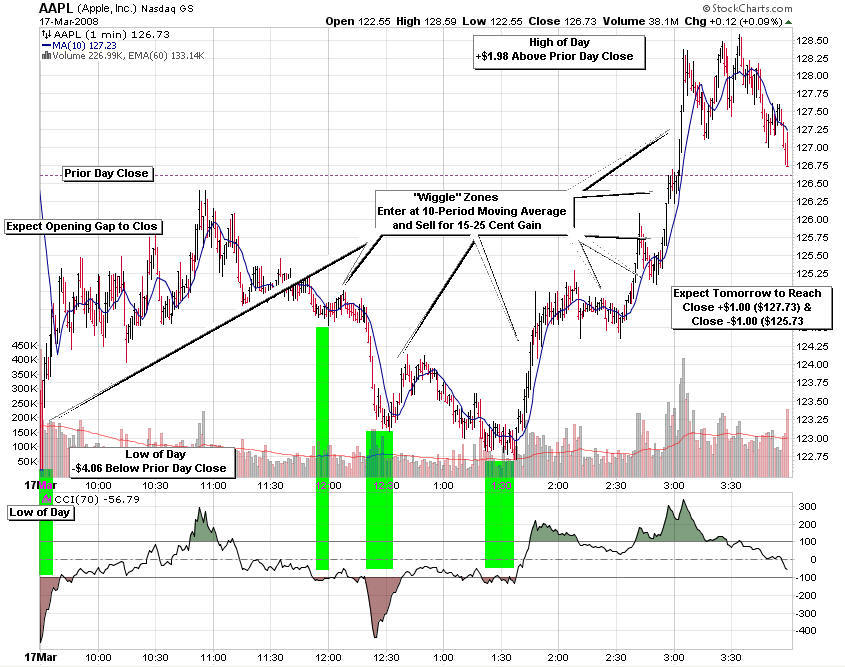
AAPL
gaped open lower, meandered for much of the day then closed the gap
on a bullish run that began at 1:30 pm. Three of the four CCI
minima marked great "Wiggle" trading zones. Today's low didn't fall
below the prior day's close and was +$2.06 higher and its high $1.98
higher. Note in the chart below, 24 of the last 30 days traded
at least $1 higher and lower than the prior day's close. The
minute chart shows both the CCI minima that mark trading zone
entries as well as various lines of support and resistance (1st hour
hi/lo closes, prior day's close, Fibonacci levels, etc.). The daily chart shows AAPL
continues to consolidate below its 50-day moving average. Note, too,
how the Bollinger bands are narrowing which is often indicative of an
impending move (springboard for higher or lower move).
AAPL Trading Maxim (5):�As was said in Maxim (4), it's a relative rare event when AAPL doesn't make both a lower low and a higher high than the prior day's close. The following chart shows AAPL's close (blue) since the beginning of 2007 and its count over the past 30 trading days of the number of days making a high today that's at least a dollar higher than yesterday's close (green) and similarly the number making a low that's at least a dollar lower (red). Since the beginning of the year, this 30-day count has produced at least 23 of 30 days (77%) reaching these metrics. So how can this relationship between today's close and tomorrow's high/lows be exploited?
- Expect the gap opening (either to the high or low side) to be closed;
- Expect the high or low of the day to be made in the 1st hour of trading;
- Expect (in today's market) at least a $1 higher high and $1 lower low than prior day's close;
- Given the above expectations, the following four strategies have an edge
- Buy prior day at close (shares or Calls) and immediately put in sell price at close + $1 (especially useful if you cannot sit at a computer the next day);
- Sell into opening gap higher then rebuild position by scaling back in at a series of lower levels: from $1 less than sales price to $3 less than prior day's closing price;
- Buy the opening gap down (>$1 down) and immediately put in a sales price at $1 higher than prior day's close;
- Buy today's intra-day low (at least $1 under prior day's close) if price has not yet risen above prior day's close, i.e., has been down trending since the open.
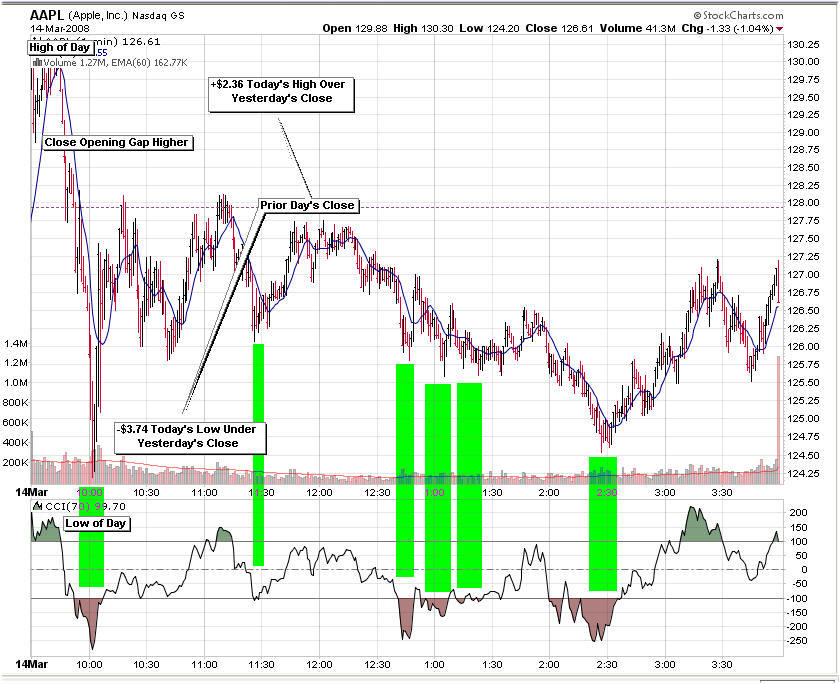
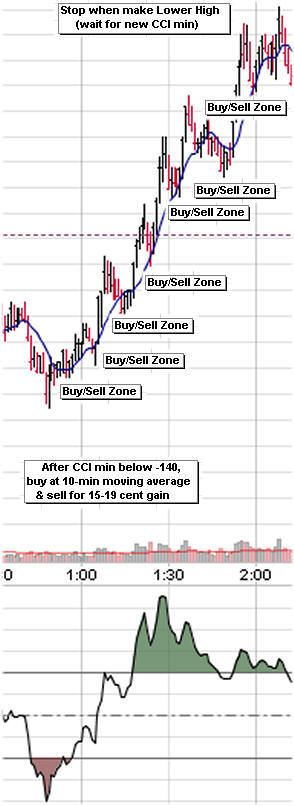
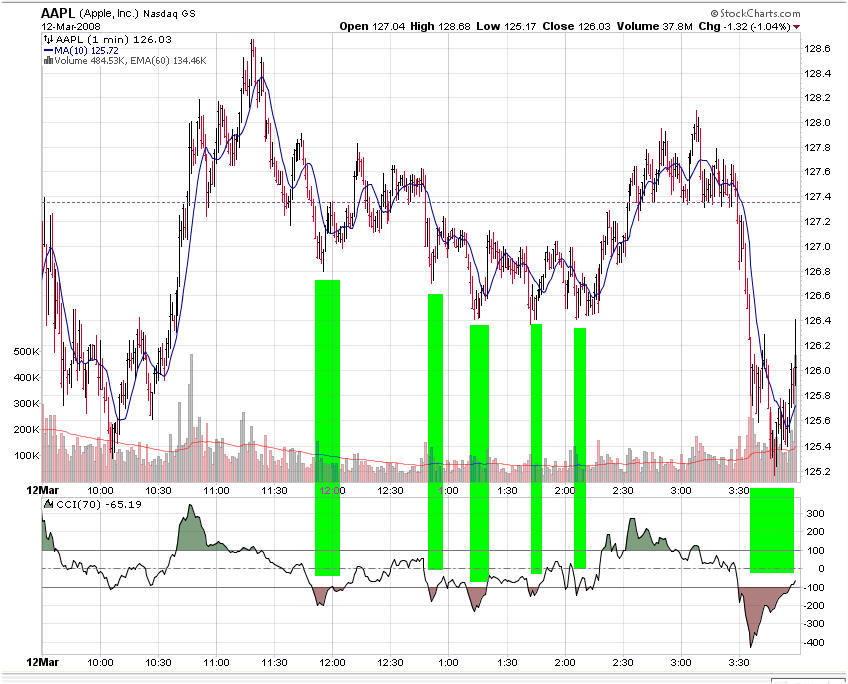
(03/14/08)
AAPL gaped open higher then fell for most of the day--save the last hour and a half of buying. Today's low fell $3.74 below yesterday's close and its high $2.36 higher. Note in the above chart, 24 of the last 30 days traded at least $1 higher and lower than the prior day's close. The minute chart shows both the CCI minima that mark trading zone entries as well as various lines of support and resistance (1st hour hi/lo closes, prior day's close, Fibonacci levels, etc.). The chart directly above identifies buy/sell zones following CCI minimum (green bars) where one could wait for price to close above its 10-period moving average then trade "wiggles", i.e., 15-19 cent profit targets and re-buying at the 10-period moving average. Then one waits for the next CCI minimum.
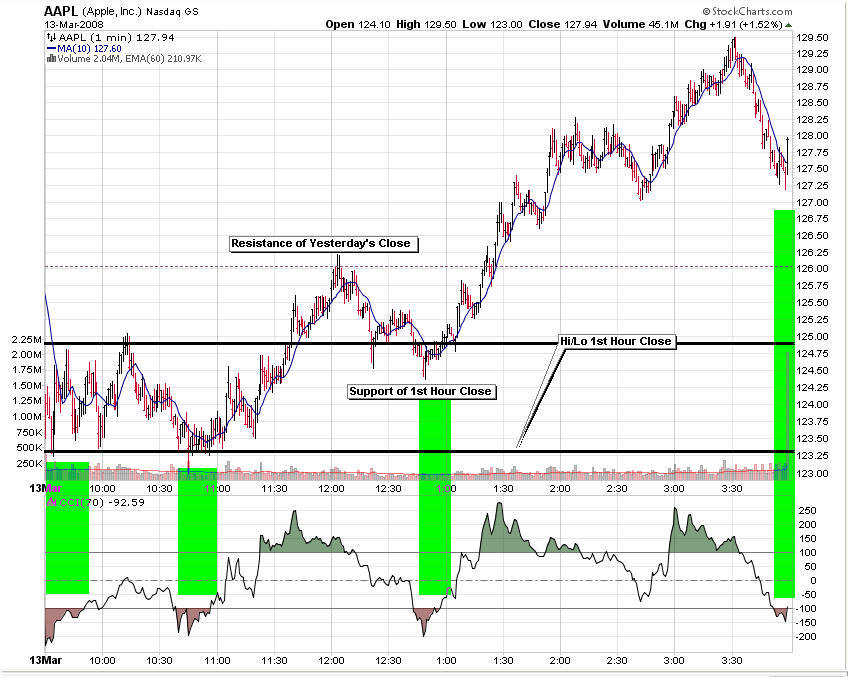
(03/13/08)
AAPL Trading Maxim (4):�It's
a relative rare event when AAPL doesn't make both a lower low and a
higher high than the prior day's close. Consequently, on an
opening gap lower, one can expect the gap to be closed and price to
move even higher later in the day--then trade appropriately.
Today's movement is a good example, but glance through the days
below to see how often lower lows and higher highs than the prior
day's close occur.
(03/12/08)
(03/11/08)
(03/10/08)
(03/07/08)
(03/06/08)
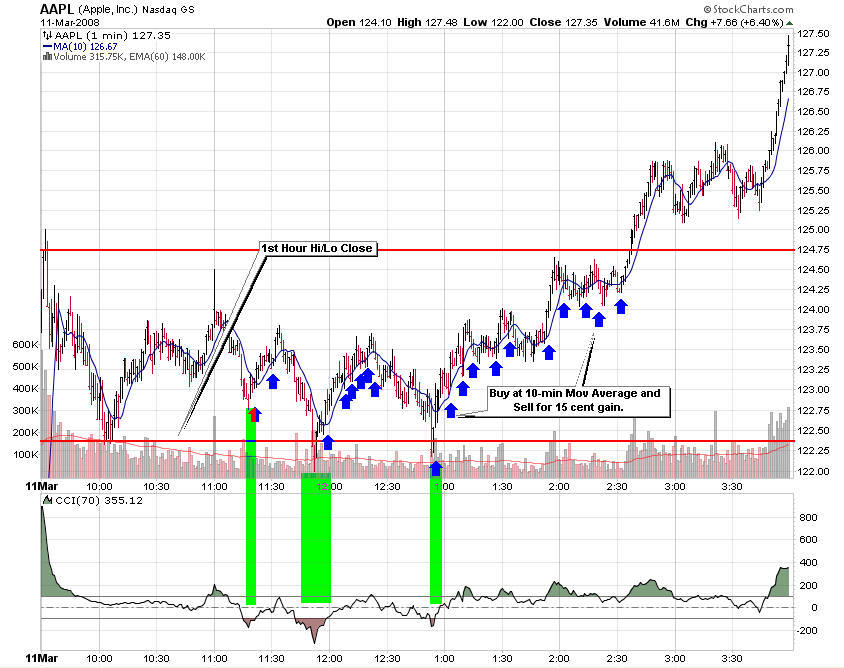
AAPL Trading Maxim (3):� On a 1-minute chart, the 10-period moving
average provides an area of both support and resistance (and a close above the
10-minute moving average). Following a CCI
minimum, buy near this moving average (buying floor) then sell for a 15-30 cent gain.
{trade 1,000 shares ($62,000 margin
account)10x during the day for $1,500 gain, 100x for $15,000}
(03/05/08)
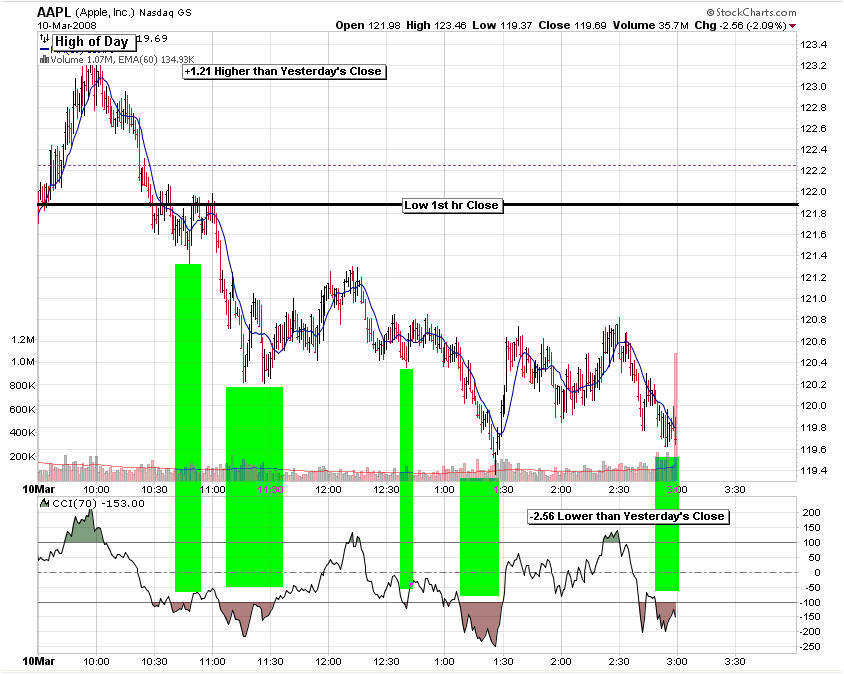
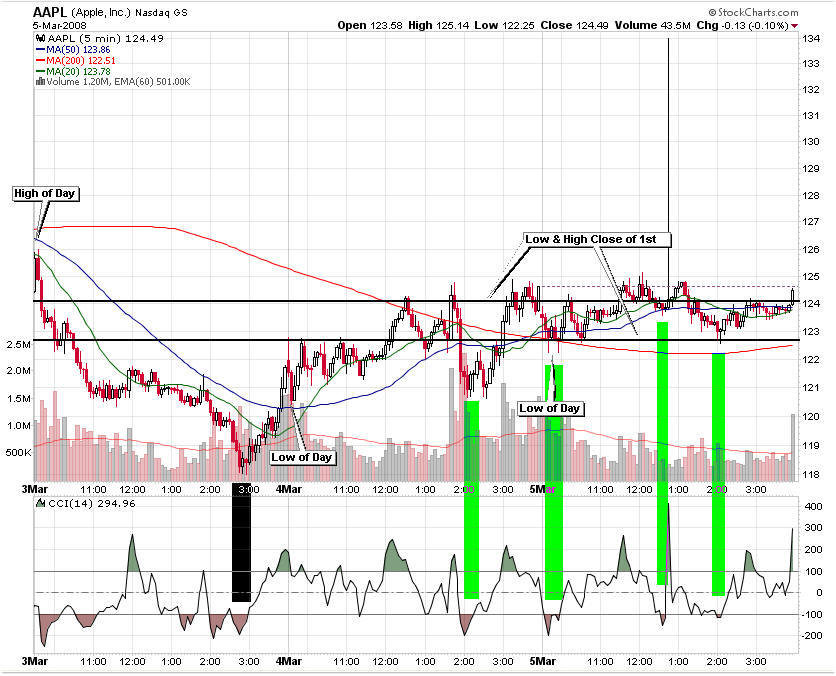
(03/04/08) Today, AAPL made the low of the day in the first 10 minutes of trading. It
then rose for much of the rest of the day, using the 1st hour high close as
resistance a few times and the 1st hour low close as support late in the day
when CCI made a major minimum. The daily chart is bullish:
closing near top of its daily range on increasing volume.
Today's low fell $1.33 below yesterday's close and its high $3.15 higher. AAPL's shares
continue to remain a bargain here at 2-year PEG ratios of 0.66 and 0.79
[next earnings report 4/24/08].
It's only a matter of time before these shares rebound much higher. To
take advantage of the relationship between today's close and tomorrow's
high, consider the following option strategy: buy 3 March 110 Calls at
close (today $15.70 or $125.70 share cost when AAPL closed at $124.50 then
put in a sell order for the next day at $15.70 + $1. With an option
delta equal to 0.90, this option's value will move at 90% of the share
price. This high probability trade is designed to make $300 ($294
after commission) on $4,710 invested (6.4% in one day). Note, this
option expires in 17 days (3/21/08).
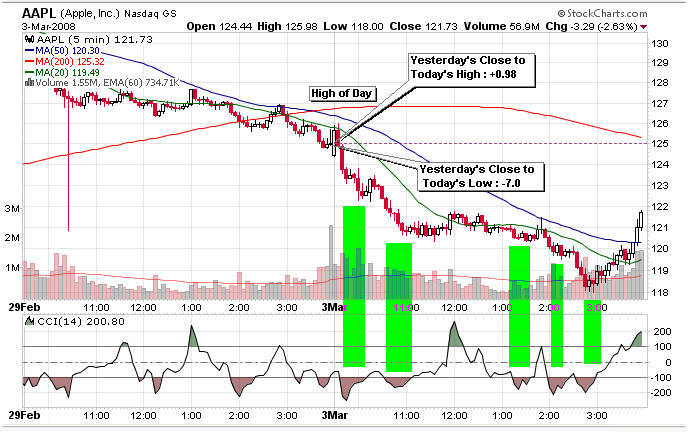
(03/03/08) AAPL,
once again,
made its high of the day in the first few minutes then fell for the next
several hour. After falling most of the day, it rose during the last
hour to make a bullish bottoming tail (daily chart). Today's low
fell $7.02 below yesterday's close and its high $0.98 higher. AAPL's shares
continue to remain a bargain here at 2-year PEG ratios of 0.65 and 0.76.
It's only a matter of time before these shares rebound much higher.
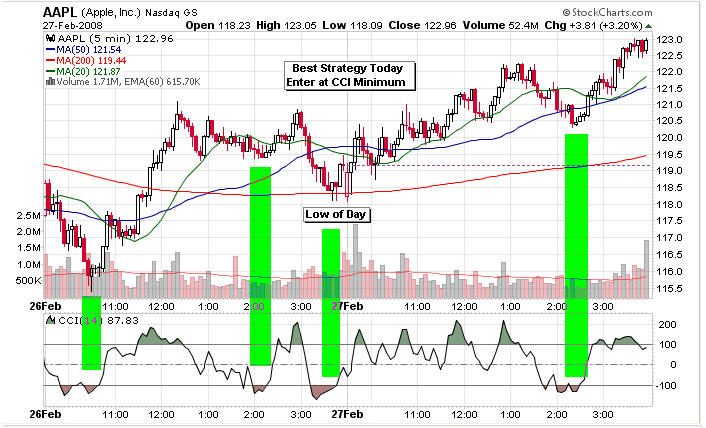
(02/29/08) AAPL
made its high of the day in the first few minutes then fell for the next
hour. Price followed by riding its low 1st hour close until
~1:30 pm when it then fell into the close. Today's low fell
$5.11 below yesterday's close and its high $0.30 higher. AAPL's shares
continue to remain a bargain here at 2-year PEG ratios of 0.65 and 0.76.
It's only a matter of time before these shares rebound much higher.
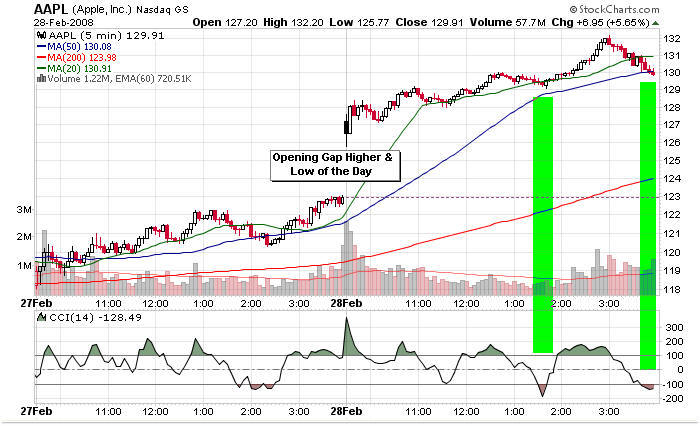
(02/28/08)
AAPL put
in another very good day, gapping up at the open then rising through
most of the day. Entering the trade above the 1st hour's high close or at
the 1:30 CCI minimum would have proved very profitable. Today's low fell
$2.81 above yesterday's close (the gap) and its high $9.24 higher. One
of the actions you should have expected on a day like to day is a sell off
in the last hour as traders take profit. Therefore, one should expect
to sell in the last 1 to 1 1/2 hours of trading when AAPL begins to sell
off. AAPL's shares remain a bargain here at 2-year PEG ratios of 0.65
and 0.76. It's only a matter of time before these shares rebound much
higher. Today's trade is a good example of another AAPL trading maxim:
AAPL's intraday moves are much more profitable than interday moves (gaps);
therefore why suffer the downside risk by holding overnight.
AAPL Trading Maxim (1): AAPL's intraday moves are much more profitable than interday moves (gaps);
why suffer the downside risk by holding overnight. (02/27/08) Overnight, you might miss a large bullish gap opening (like tomorrow
02/28/08). This is always a concern because AAPL is one of the
best stocks available, and it has a lot of institutional support.
Further, it's way undervalue (PEG ratios less than 1.0) at these
prices. Second, if you buy intraday strength (instead of
intraday pullbacks), you're apt to be caught holding shares while
AAPL pulls back several dollars quickly (I've seen it lose $2 in two
minutes). If I get caught holding shares here, I like the fact
that AAPL is both fundamentally strong and has institutional
following, i.e., I know that AAPL will come back soon if I'm
forced to hold shares. AAPL
gaped lower then pushed higher for most of the day--save the last
half hour profit taking. Today's
low fell $3.03 below yesterday's close and its high $3.47 higher.
The minute chart shows both the CCI minima that mark trading zone
entries as well as various lines of support and resistance (1st hour
hi/lo closes, prior day's close, Fibonacci levels, etc.). The
chart directly above identifies buy/sell zones following the mid-day
CCI minimum (and the close above the 10-period moving average).
One continues to execute these 15-19 cent profit targets until a
lower peak is made. Then one waits for the next CCI minimum.
AAPL
consolidated its gains today. The daily chart, with its topping
tail, is bearish for Thursday. Today's low fell $2.18 below yesterday's
close and its high $1.30 higher. AAPL's
shares continue to remain a bargain here at 2-year PEG ratios of 0.66 and
0.79 [next earnings report 4/24/08]. It's only a matter of time before these
shares rebound much higher.
AAPL
took off late in the day with the market. Note, the above chart is a 1-minute
chart. If you're day trading AAPL, it's the chart to use. Too,
I've converted the 14-period CCI 5-minute chart to the equivalent 70-period
1-minute chart. The CCI minima still provided an edge for the rise
following the CCI minima. Note here how the 10-period moving average provided both
support and resistance. Use it following a CCI minimum by buying near
the 10 and selling 15-30 cents higher. The blue arrows mark entry
points. The daily chart is very bullish for
Wednesday: closing at the top of its daily range. Today's low fell $1.31
above yesterday's close and its high $7.79 higher. AAPL's
shares continue to remain a bargain here at 2-year PEG ratios of 0.66 and
0.79 [next earnings report 4/24/08]. It's only a matter of time before these
shares rebound much higher.
AAPL
again made the high of the day in the first hour, but it then fell for the rest of the day. Note, the above chart is a 1-minute
chart. If you're day trading AAPL, it's the chart to use. Too,
I've converted the 14-period CCI 5-minute chart to the equivalent 70-period
1-minute chart. Again, it's difficult to play the long side exclusively on a
day like today, but the CCI minima still will provide an edge for the short rise
following the CCI minima. Note here how the 10-period moving average has provided both
support and resistance. Use it following a CCI minimum by buying near
the 10 and selling 15-30 cents higher. The daily chart is bearish for
Tuesday: closing at the bottom of its daily range, but the low volume
testifies to the lack of selling conviction. Today's low fell $2.56 below
yesterday's close and its high $1.21 higher. AAPL's
shares continue to remain a bargain here at 2-year PEG ratios of 0.66 and
0.79 [next earnings report 4/24/08]. It's only a matter of time before these
shares rebound much higher.
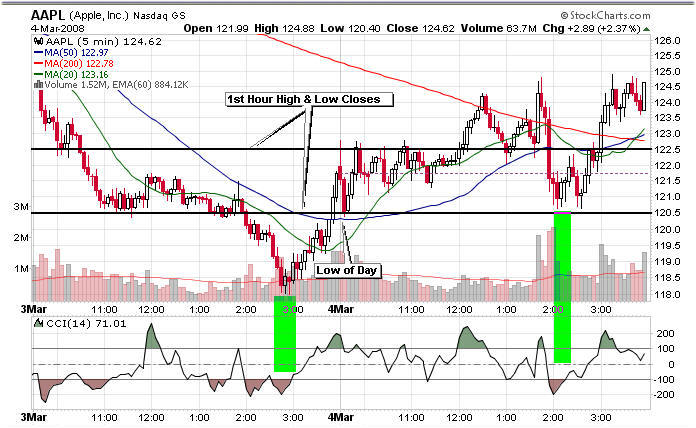
Today, AAPL
again made the high of the day in the first hour and a half, fell for much
of the rest of the day, then pushed higher during the last hour and a half. Note, the above chart is a 1-minute
chart. If you're day trading AAPL, it's the chart to use. Too,
I've converted the 14-period CCI 5-minute chart to the equivalent 70-period
1-minute chart. Again, it's difficult to play the long side exclusively on a
day like today, but the CCI minima still provide an edge for the short rise
that followed. Note here how the 10-period moving average has provided both
support and resistance. Use it following a CCI minimum by buying near
the 10 and selling 15-30 cents higher. The daily chart is bullish for
Monday: closing near the top of its daily range. Today's low fell $1.88
below yesterday's close and its high $2.05 higher. AAPL's
shares continue to remain a bargain here at 2-year PEG ratios of 0.66 and
0.79 [next earnings report 4/24/08]. It's only a matter of time before these
shares rebound much higher.
Today, AAPL
again made the high of the day in the first hour of trading then fell for
much of the rest of the day. Note, the above chart is a 1-minute
chart. If you're day trading AAPL, it's the chart to use. Too,
I've converted the 14-period CCI 5-minute chart to the equivalent 70-period
1-minute chart. Though it's difficult playing the long side exclusively on a
day like today, the CCI minima still provided an edge for a period of time
that followed. Note here how the 10-period moving average has provided both
support and resistance. Use it following a CCI minimum by buying near
the 10 and selling 15-30 cents higher: notice how well that strategy
would have worked in the initial run up, in the bullish period following the
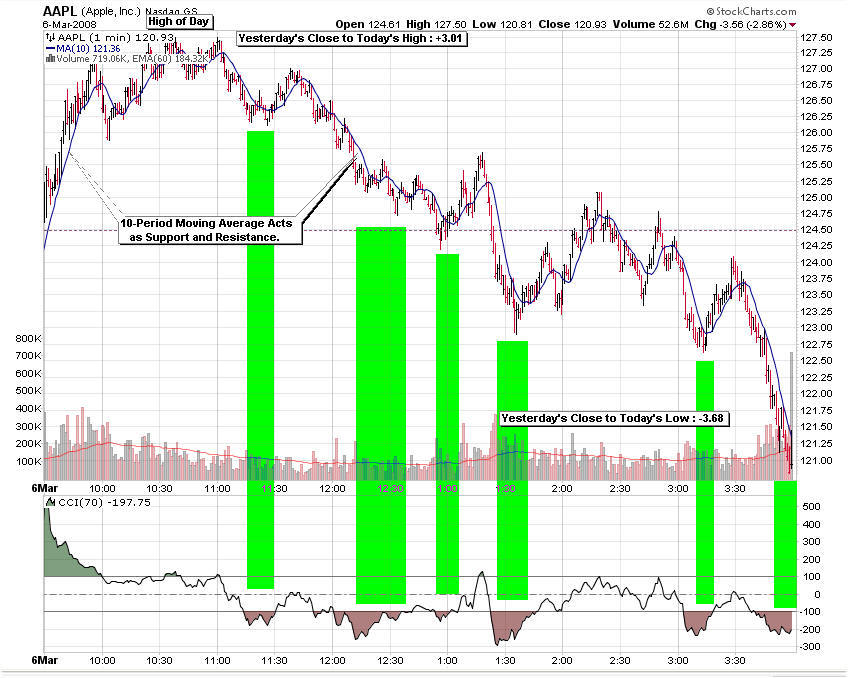
11:30, the 13:00, the 13:30 and the 15:15 CCI minima. The
daily chart is clearly bearish for tomorrow: closing at the bottom of its
daily range. Today's low fell $3.68 below yesterday's close and its high
$3.01 higher. AAPL's
shares continue to remain a bargain here at 2-year PEG ratios of 0.66 and
0.79 [next earnings report 4/24/08]. It's only a matter of time before these
shares rebound much higher.
Today, AAPL
again made the low of the day in the first 10 minutes of trading. It then
consolidated sideways for much of the rest of the day, using the 1st hour high
and low closes as resistance and support over the day. Too, the
CCI minima provided short-term profitable trades during the day. The
daily chart is bullish: closing slightly higher near top of its daily range.
Today's low fell $2.37 below yesterday's close and its high $0.52 higher. AAPL's
shares continue to remain a bargain here at 2-year PEG ratios of 0.66 and
0.79 [next earnings report 4/24/08]. It's only a matter of time before these
shares rebound much higher.
Relationships Between Yesterday's Close and Today's High and Low
The below chart shows the relationship today's high (green) and low (red) versus yesterday's close. Note, each box is a 10-day moving average. The white boxed at the top show the relationship between today's high and yesterday's low (again the 10-day moving average). The idea is to find market truths that a trading strategy can be built around (like the tendency for AAPL to make either the high or low of the day in the first hour of trading. Two new strategies look profitable: (1) buy the close of the day and sell the following day at close1 + X where X is just under the 10-day average of the 2nd-day high; (2) opening the day flat, buy today at yesterday's close - Y where Y is just above the 10-day average of the 2nd-day low. Expected Tuesday High (119.74 + 2.46), Tuesday Low (119.74 - 2.11), and Monday low to Tuesday high (4.43).
AAPL Trading Maxim (2):
More than three-quarters of the time AAPL makes the highs or lows of the day in the 1st hour of trading.
The following chart shows that
over 52 trading days,
~82% of the days either the low or high of the
day occurred in the first 60 minutes--another
~55% of the time
they occurred in the last 60 minutes of the trading
day. That's something you
can plan a strategy around: buy the gap down
after it reverses or sell into the gap up.
What is the Commodity Channel Index (CCI)?
As a refresher, CCI14 = [(TP - <TP>14) / <TP>MD ] x 66.7 where TP (typical price) = (High + Low + Close)/3; <TP>14 is its 14-period (1 min, 5 min or 1 day) moving average; <TP>MD is TP's mean deviation defined as Σ (abs(TPi - <TP>14)) / 14 (from i=1 to 14). So what do all these numbers mean? That is, what do CCI14 values of -100, of -150 and of -200 mean?
CCI14 = -100 means TP = <TP>14 - 1.5<TP>MD or the current TP is less than the 14-period average TP minus 1.5 mean deviations (a measure of variability)
CCI14 = -150 means TP = <TP>14 - 2.25<TP>MD
CCI14 = -200 means TP = <TP>14 - 3.00<TP>MD
As CCI14 grows more negative, the current TP becomes increasingly lower than its average value. It's like a stretched rubber band that increasingly unlikely to extend further. Instead, it's much more likely to rebound.
What is the Relative Strength Index (RSI)?
Larry Connors of TradingMarkets.com has shown that the 2-period RSI (and its improved strategy for either trading the S&P or forecasting its short-term movement) is much more predictive of future price action than the more conventional 14-period RSI. Let me show you here what it really means.
RSI
2 = 100 - 100 / (1+ RS2) where RS2 = <up closes>2 / <down closes>2 ( <up close>2 is the average of up closes over the last two periods)Note, if <down closes>2 equals 0, then by definition RSI2 equals 100.
RSI2 = 100 if both periods have up closes and RSI2 = 0 if both periods have down closes. If one period closes up (uc) and the other closes down (dc), then
RSI2 = 100 - 100 / (1 + uc/dc)
= 100 - 100 / {(dc+uc)/dc}
= 100 - 100 (dc) / (dc+uc}
= 100 {1 - dc / (dc+uc)}
= 100 {uc / (dc+uc)} or RSI2 (or for that matter any number of periods) is the percentage of the up close (or average up close)
Note, both uc and dc are positive (absolute) values.