 |
FEEL FREE TO PRINT THIS WEEKEND REPORT
|
"An
Approach to Successful Stock Trading Combining Company
Fundamentals with Chart Technicals" |
|
Comments or Questions (TSM Service, Methodology, Performance
or Your Success Stories)
Go Here
-
(rmiller@triplescreenmethod.com)
|
It can only help and investor or trader to know
where money is flowing: into what sector, into what investment type, into
what area of the world. All these markets are linked to one another, and
now with the development of ETFs, this linkage can be easily followed. In
you're interested in more detail, I highly recommend John Murphy's " Intermarket
Analysis: Profiting from Global Market Relationships." Inter-Market
Linkage
|
-
UUP - Dollar
-
FXE - Euro
-
FXY - Japanese Yen
-
CYB - Chinese Yuan
-
TLT - 20+ Year Bond
-
IEF - 7-10 Year Bond
-
EFA - International Fund
(Europe/Australasis/Far East)
-
VGK - Europe
-
EEM - Emerging Markets
Fund
-
IWM - Russell 2000
-
FXI - China
-
RSX - Russia
-
EWZ - Brazil
-
EWG - Germany
-
EWU - Great Britian
-
EWQ - France
-
EWC - Canada
-
$BDI - Baltic Dry Index
-
TYBS - Daily 20+ Year Treasury Bear 1X Shares
-
TMV - Daily 20+ Year Treasury Bear 3X Shares
-
TYNS - Daily 7-10 Year Treasury Bear 1X Shares
-
TYO - Daily 7-10 Year Treasury Bear 3X Shares
|
- TBT - 2x Inverse 20+ Year Bond
SH - 1x Inverse S&P SDS - 2x Inverse S&P SPXU - 3x Inverse S&P QID - 2x Inverse QQQ TWM - 2x Inverse Russell 2000 VTI - Total Market -
VEU - Total Market Ex U.S.
XRO - Zacks Sector Rotation -
CRB - Commodity Index
-
DVY 0 Dividend Stocks
-
AGG - Total US Bond Market
-
HYG - High Yield Corporate Bond Funds (Junk Bonds)
-
YCS - 2x Inverse Yen
|
-
DBC - Commodities
-
USO - Oil
-
GLD - Gold
-
SLV - Silver
-
JJC - Copper
-
UNG - Natural Gas
-
ITB - Home Construction
-
XHB - Homebuilders
-
XLB - Materials
-
XLV - Healthcare
-
XLP - Consumer Staples
-
XLY - Consumer
Discretionary
-
UGA - USA Gasoline Fund
-
XLE - Energy
-
OIH - Oil Service
Holders
-
SMH - Semiconductor
Holders
|
|
12/27/13... The following plot
shows
that both the Baltic Dry Index and the 10-year Treasury yield have generally
tracked one another since the downturn in 2008.
The BDI measures shipping rates for dry bulk commodities, mainly coal, iron
ore, and grains. It is also a measure of global demand. John Murphy
suggests that the main demand is coming from China's need for iron ore.
Rising
shipping rates reflect an increasing demand for natural resources, which is
normal in a global economic recovery, and such a recovery normally results
in higher bond yields. 
Copper is also a good indicator of improving economic activity, and this month has produced its highest price since May. Watch those companies involved in metals,
e.g., AA,
X, STLD, NUE, AKS). 
|
| 03/28/13.... The following plot shows the relationship between the S&P 500 and the 20 year Treasury Bonds (TLT). Notice how the rise in the S&P (green) from December through March had been fueled by the drop in the Treasuries (red), i.e., a negative or inverse correlation shown in the top window (20-day correlation between the S&P and TLT). Money had been coming out of bonds and entering the market. That changed in April, as the correlation has turned positive or more direct, and the two moved up together. In May, however, they began to move in opposite directions again (the S&P up and the bond market down). Money is now flowing from bonds into the market.
|
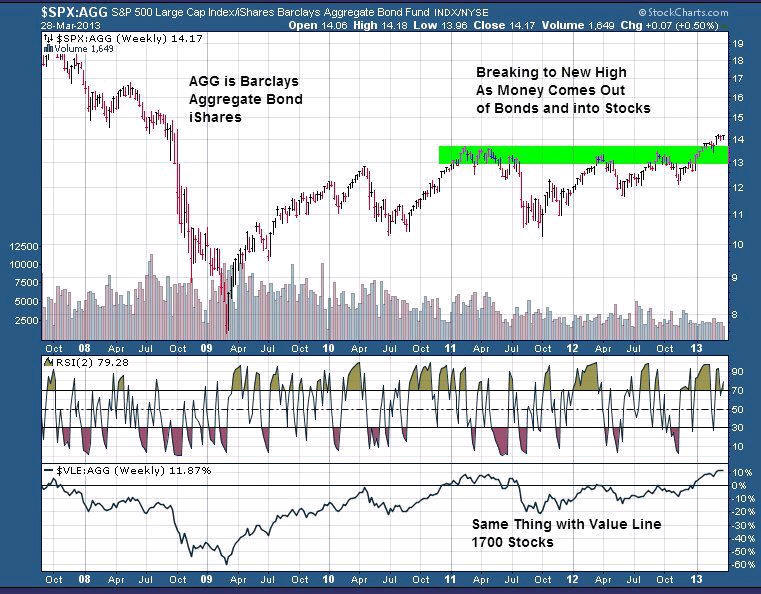
| 03/28/13... The S&P 500 is nearing its October 2007 intra-day peak at 1576 and its 2007 closing high at 1565. A new record high seems more and more likely given the alternative choices available to global investors.
Fixed income investors are moving more money from bonds to stocks, and a rising dollar has made commodity assets much less attractive than stocks. Further, problems in emerging markets (like China) and developed markets (especially Europe) are also driving funds into U.S. stocks.
The chart (S&P-to-AGG ratio) shows how money is continuing to move from bonds into the stock market as measured by both the big-cap S&P and the 1700 equally weighted stocks in the Value Line Index.
01/06/13 ... Money Flows from Bonds
into the Market.
As seen in the following two weekly charts of
bond value and bond yield, money is starting to flow from the bond market.
The 7-10 yr bond ETF value has dropped to the support of its 50 week
average, while the 10-yrear treasury rate has increased --these two will
move inversely to one another. This means that money is flowing
from the bond market, most likely into the stock market. Notice
the increase in the weekly chart of the S&P. The market looks
bullish to this point.
06/29/12 ... Money Flows to
Safety of Dividend Stocks from Low Return Bonds.
Since the first of last year, most of the time there has been an inverse relationship (negative correlation) between the value of the dividend
stock ETF (DVY) and bond yields ($TNX). As bond rates have fallen, money has flown into the safety
and yield of dividend paying stocks. Top holdings of DVY: CVX, LMT,
KMB, ETR, LO, CTL, TEG, PPG, DTE and WSO
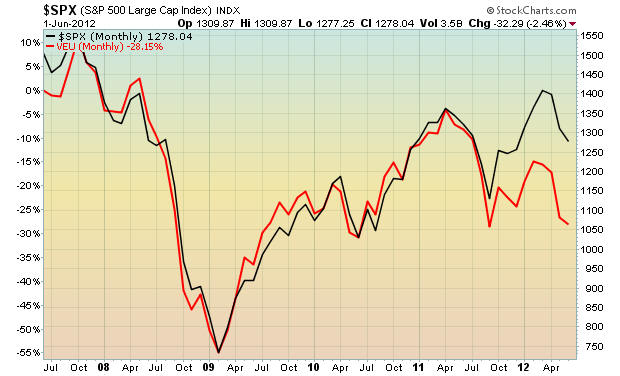
06/01/12 ... Relationship between US
Stock and Ex US Stock Performance ($SPX vs VEU).
Over the past five years (and generally), domestic and foreign stock performance has trended
in the same direction. That's changed over the past few months where
the S&P exceeded its 2011 high and foreign stocks didn't. This
recent bigger drop in foreign stocks is largely due to the improving
value of the dollar, as a rising dollar has a bigger impact on foreign
companies as they do business in local currencies, but the conversion to
the dollar costs them more. Money is flowing into U.S. Treasuries, in a
general flight to safety.
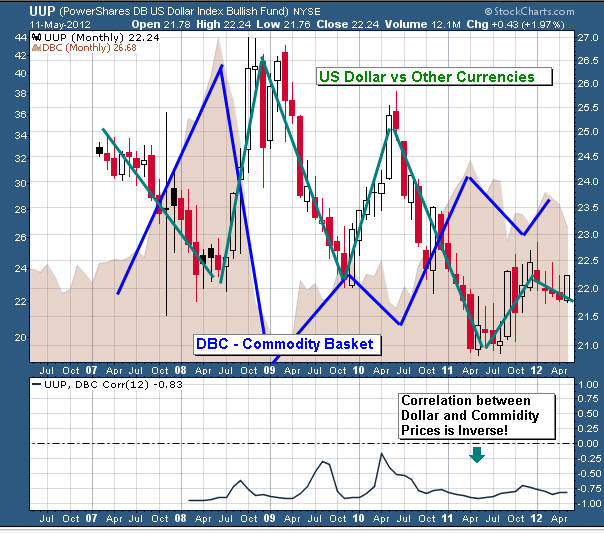
O5/12/12 ... Relationship between Dollar Strength and Price of Commodities (UUP vs
DBC). One very important inter-market relationship is the relationship
between these two markets: the strength of the dollar and the value of
commodities. That's evident visually in the chart below, as well as the
degree of correlation plot at its bottom, one based on a running 12 months
of data. Note, a perfectly inverse relationship would have a -1
correlation coefficient. Obviously, a stronger dollar depresses
commodity prices (e.g., oil, gold, silver, etc.). Harry Dent (market
analyst who bases his work on population demographics and technology growth
cycles and who has written a number of impressive books including "The Great
Boom Ahead in 1993" and "The Great Crash Ahead" in 2011) forecasts a deflationary state for the economy
beginning this year where the dollar will regain its strength both
internally and within the world. A deflationary state is one where
cash is king and prices fall. It's worth keeping one's eye on the value of
the dollar because the stock market will react very differently to a
deflationary vs inflationary state, and most of the world thinks the latter
is the state we'll enter with our excessive debt and money supply.
John Murphy has written that a rising dollar favors US stocks over foreign
stocks (seen in the relation between $MSWORLD, ex-US World Stock Index vs
the S&P).
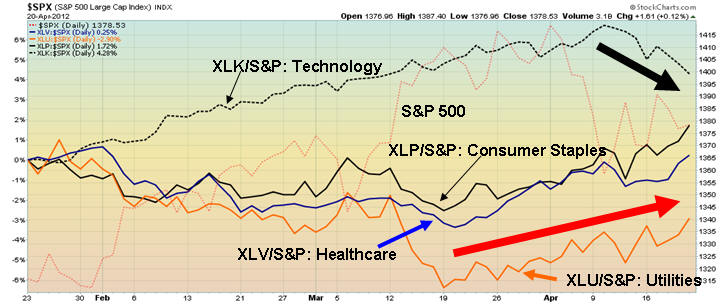
04/20/12 ... Sector Rotation into Defensive Sectors
(Healthcare - XLV, Utilities - XLU and Consumer Staples - XLP). As
we enter the bad five months of the year (June through October, though some
would include May as well -- see this article), the odds say that the market will underperform.
Let's take a look at how the market is currently rotating its sectors. Four
sectors are plotted relative to the S&P 500, i.e., they measure each one's
performance relative to the S&P. Since the beginning of April,
technology has been falling off (e.g., AAPL), while utilities, consumer
staples and healthcare -- all defensive sectors -- are starting to lead.
Note, how the reverse was true for these four from the first of the year
through March, as the market drove higher. Clearly, investors are
protecting themselves for an expected turndown.
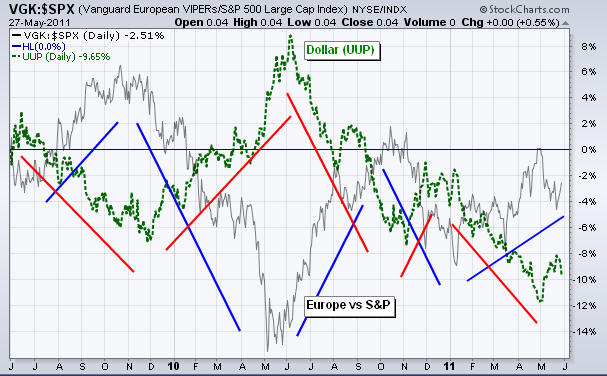
5/27/11 ...
The Dollar's strength impacts the relative value of US against foreign
stocks. It's a yardstick for the strength of their relative economies.
As John Murphy (StockCharts.com)
points out, when money flows into the US markets, the dollar grows
stronger, and it's value moves higher. Thus, a stronger currency reflects a
strengthening U.S. economy. There's a downside however. When U.S. stocks
become favored over foreign stocks, American investors can lose money
two ways when they invest in foreign stocks: by falling stock prices and by
the weakening foreign currency. Conversely,
foreign stocks do better relative to US shares when the dollar weakens,
though it's true that will favor some of our big international stocks. The
following
chart contrasts the movement in the European market (VGK) relative to the
S&P 500(grey line) versus the trend in the US
Dollar Index's (UUP) (green line) movement over the last two years. When the
dollar strengthened, the European market fell relative to the S&P, and
conversely, when the dollar weakened, the European market outperformed the
S&P.
This inverse trend in the two is easily seen in the inverse relationship
between the red and blue trend lines.
|
|
5/27/11 ... The Market rotates by
favoring its different segments. In the following chart, the rotation
among the market capitalizations and their respective value/growth
sub-segments is shown for the past two years -- all relative to the large
cap S&P. Clearly, small and mid cap growth stocks are now favored
while larger cap value was favored earlier in the year.
 |
|
5/27/11 ... Money flows among its
various
investment vehicles. When the market's risk increases, it tends to
flow into defensive measures. As shown in the chart below, which
tracks the performance of various vehicles against the S&P, over the past
past couple of months, the defensive segments (Consumer Staples, Healthcare,
Utilities and Bonds) have outperformed the S&P while Energy and Commodities
have underperformed. That's tending to reverse over this past few
weeks.
 |
|
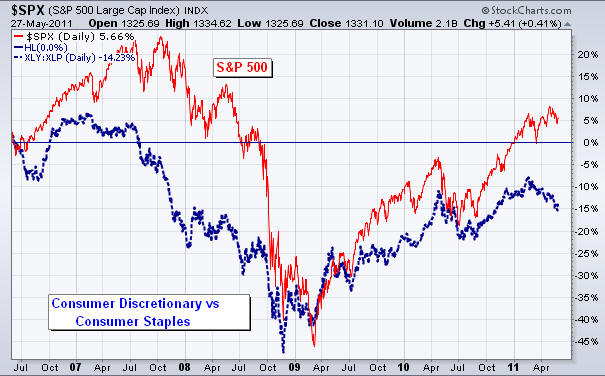
5/27/11 ... The Relationship
between the performance of the Consumer Discretionary and
Staples sector provides us another metric to track market health. As
the economy turns down, Consumer Staples--things like toilet paper and
toothpaste--are always needed while those more discretionary purchases are
put off; hence, the ratio moves directly with the S&P, falling when it turns
down and rising when it rises. Of most interest to us now is that the
ratio seems to be turning over these past few weeks, as we now enter the bad
five months of the year for stop performance.
 |
|
|
|