TripleSceen has a Facebook presence here. I will copy many of my posts and important links here Interesting Links .....Motley Fool: 8/21/17 How to Invest in Dividend Stocks the Best Way - here _________________________ 11/17/20...When you sell Puts, you profit from an increase in its underlying's price, from a decrease in its implied volatility, and from time running out. Unlike the stock owner, who profits only when the underlying stock's price moves higher, the Put seller profits when the underlying's price moves higher, stays the same, or drops to the Put's strike price less its option premium. Thus selling Puts is more conservative than owning shares.
11/17/20...Trading Quality Stocks - Taking Losses
The important thing about trading
quality stocks is that those are the stocks that institutions are interested
in as well (they provide an estimated 80% of the trading volume). They
provide a safety net for your trades, if you are forced to hold them.
The most important aspect of trading
- also the most difficult - is taking a loss in a quality stock. The trading
strategies that I use are 85-90% successful, but the key to building my
account is how I handle the 10-15% that go against me. This is still a truth
I live with in over 30 years of trading.
The quickest way to blow up your
account is this scenario: buy a stock with great fundamentals; it goes down
so you buy more shares; it continues to drop, and you think there's more
value here, so you add to your shares. Before you know it, you have invested
a large chunk of your account in this one stock, but you know it's going to
rebound at the major area of support its falling too. You invest more, as it
falls to that support, and then you see a change in its fundamentals: Zacks
ranking becomes a 4; its industry strength has rotated from a top 50 to a
bottom 50; and it just dropped its consensus estimates over the past 7 days.
You either sell at a massive loss or hold the shares, write Calls against
them, and continue to hope for a rebound. At best, you have dead money for a
long time; at worst, your account has a large ding, even though you have
used a strategy that produces 85-90% winners.
I contend that taking a loss is the
most important skill you need to develop as a trader/investor.
Develop
Rules for Taking Losses
You set the x, y, and z percentages.
11/14/20...#TSM_Modeling - Fibonacci
Numbers, Golden Ratio, and the Market
In the stock market, the price of
a stock is set by people representing all sorts of levels of
information, intelligence, and resulting expectations: traders betting a
stock’s price direction over the next few minutes to next few weeks,
long-term investors expecting the value of their shares to rise and
short-sellers betting the price of a stock will fall. Through their
collective buying and selling, the market efficiently prices the value
of a company's stock.
This crowd's response to fear and
greed manifests itself in predictable chart patterns, e.g., the
multi-day pullback after a period of steady rise followed by its
reversal at specific levels of symmetry (often common Fibonacci levels).
These are crowd responses that have played out the same way for the past
100 years.
Fibonacci ratios likely measure
the balance between human fear and greed, i.e., as price falls, fear
dominates, and sellers rule, but a point is reached where greed enters,
an opportunity is perceived, buyers again rule, and price climbs.
Years ago I poled a group of 121 traders
for their preference as to where they would expect the reversal of a
pullback to begin. They were shown a picture of rising daily bars (white
bars on Chart 1 without the percentages) and then asked to choose a
point at which they thought this pullback would most likely reverse: 1.7% chose
a 12% reversal, 0% a 19% reversal, 5% a 27% reversal, 77.4% either
the 38, 50,
or 62% (most common Fibonacci
reversals), 9.2% a 75% reversal,
and 5% a 91% reversal.
It’s natural for the crowd to
expect a reversal at these three standard Fibonacci levels. That’s where
they want to step in to buy again! That's where they perceive the stock
is a bargain again! It's a natural symmetry expected by the crowd.
The table shows the first 30 Fib
numbers (start with 0,1 and add consecutive numbers to form the next
one) and several of their ratios. It turns out that this sequence is
being used in many areas of our life: nature as an optimum packing
sequence, architecture, music, art, and many areas of mathematics. Turns
out, it's also important in stock trading.
11/12/20...
#TSM_ShortPuts - Since
Oct 2nd (30 trading days), I've made 67 short Put trades of which 61 (91%)
were profitable with an average win of $405, and an average loss of $785
(with an average 5.1% downside protection). The expected value (EV) for
these trades was then:
EV per trade = 0.91*$405 - 0.09*$785 = +$298 per trade
or $19,966 earned for the 67 trades
Since the average cash backing per
trade required $53,426, and the average time in each trade was 4.2 days, the
annualized return of this short Put strategy was 48.5%.
This short
Put strategy key:
A Put's premium rises as the
underlying's price drops or its implied volatility increases. It drops as
the underlying price rises, its implied volatility falls, and/or time
passes. When we sell a Put, we want the premium to fall: its underlying's
price to rise and/or its implied volatility to drop; but we'll still
generate max profit if its price remains the same (less but still profitable
if the underlying's price drops below its Put strike price up to the amount
of the premium.
The accompanying chart shows the
impact of time on premium value: the more rapidly it falls, the better the
trade.
This is not rocket science, just a
conservative strategy to generate a decent return on your cash that beats
putting it instead in a bank CD.
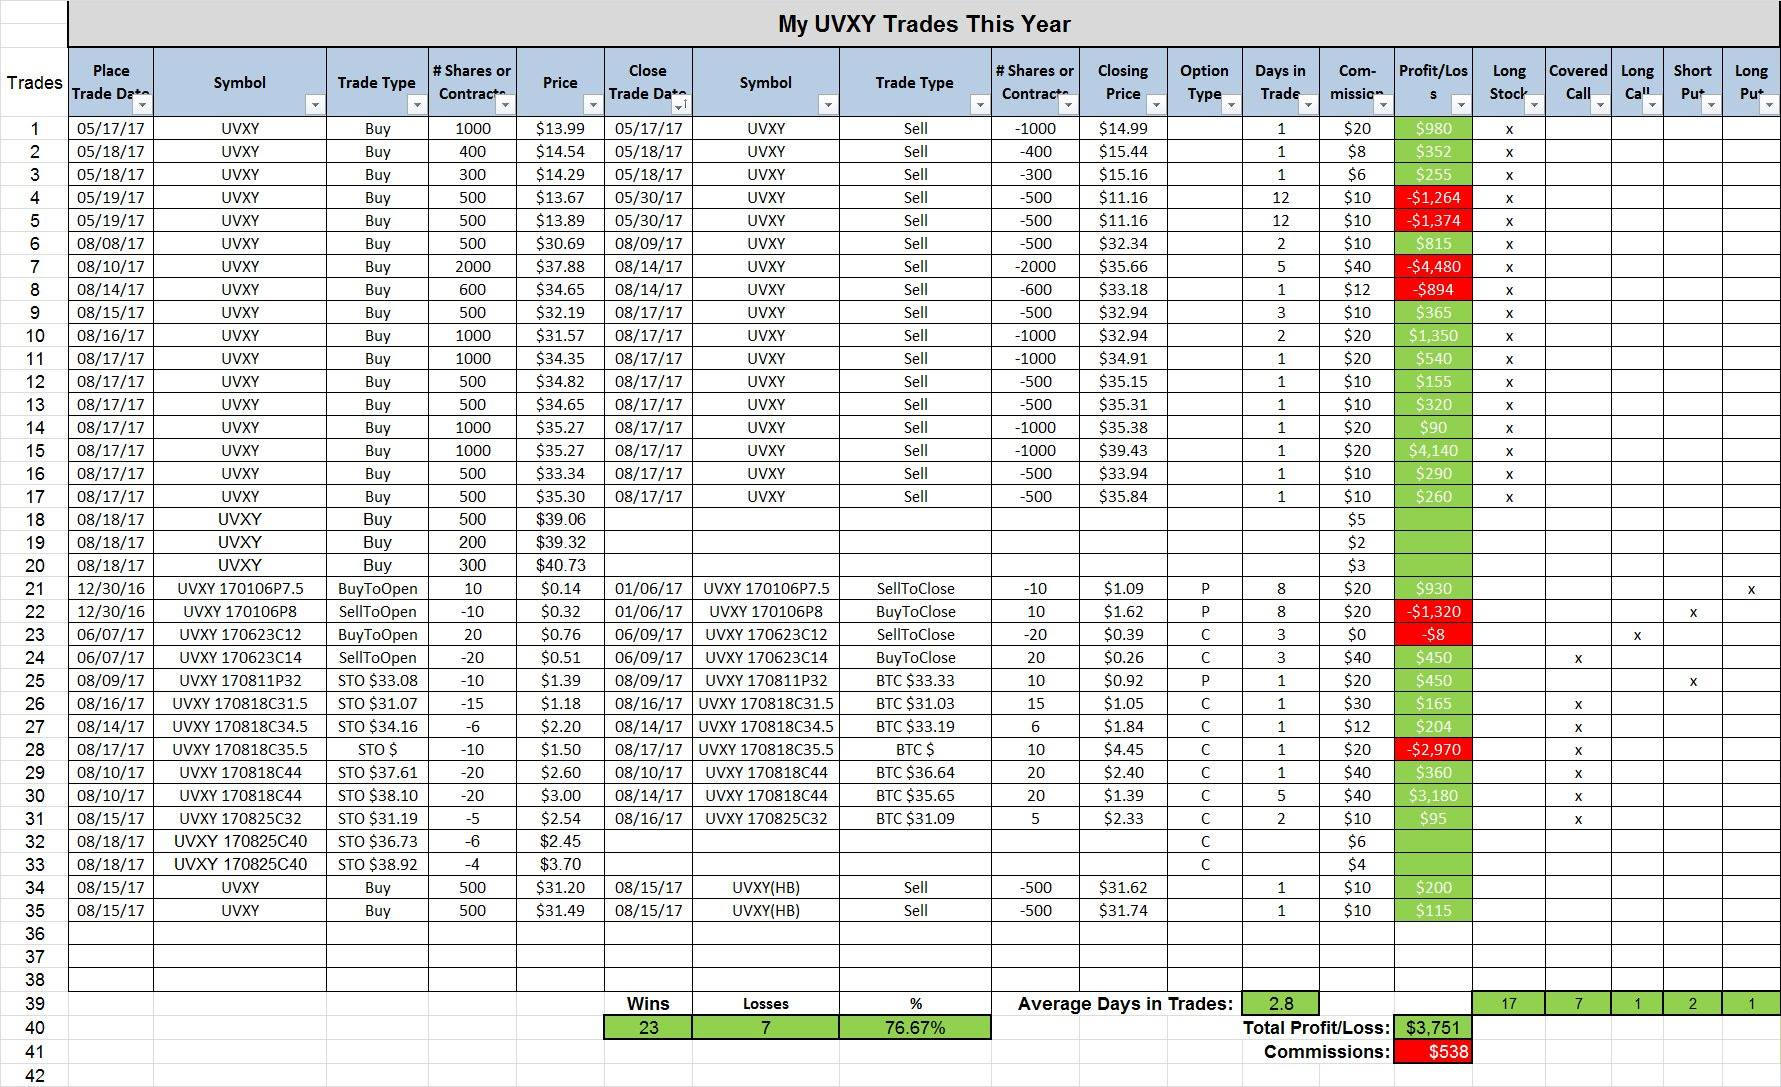
Since May, I have been trading UVXY, which is the 2x leveraged ETF for the VIX. I've made 35 trades, closed 30 of them for a 77% win rate earning $3,751 profit (17 long shares, 7 covered Calls, 1 long Call, 2 Short Puts and 1 Long Put). Note too, my average trade length has been 2.8 days. These leveraged funds are designed to be very short term because of the impact of daily rebalancing and contango. UVXY is a derivative of the VIX that uses its two front month futures, both of which trade at a premium to the VIX. As these contracts age (and the time value of the premium falls, they are replace with new contracts). The net effect is that over the long term, UVXY is a losing trade. I'm currently long 1,000 shares.
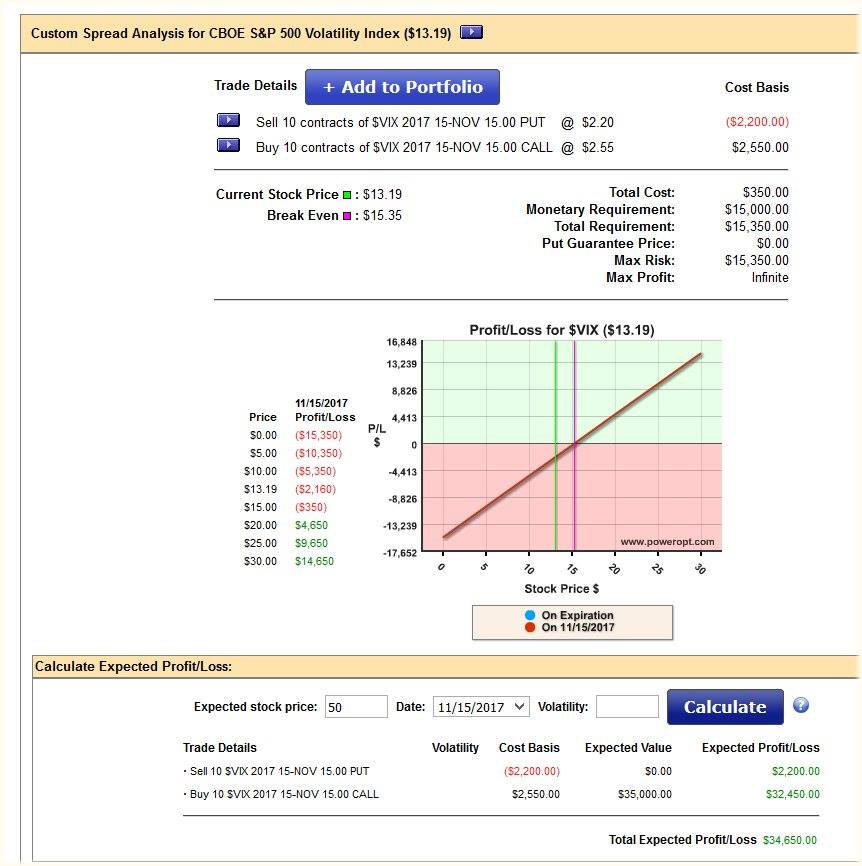
Five Key Strategies for Volatility Trading Another good link explaining the contango impact on UVXY One of the measures that I have taken to protect against a market downturn is to buy VIX Calls and pay for them by selling Puts. Specifically, I bought 10 Nov $15 Calls for $2.55 and sold 10 Nov $15 Puts for $2.30 (cost $350 with a cash backing requirement as well--but may cost more if in 84 days if the VIX is lower than $15). The example shown in the chart is VIX reaching $50, which it has done in the past, and my position reaching $34,650. Of course, if this trade is a loser, I feel my long positions will more than make up for the cost.
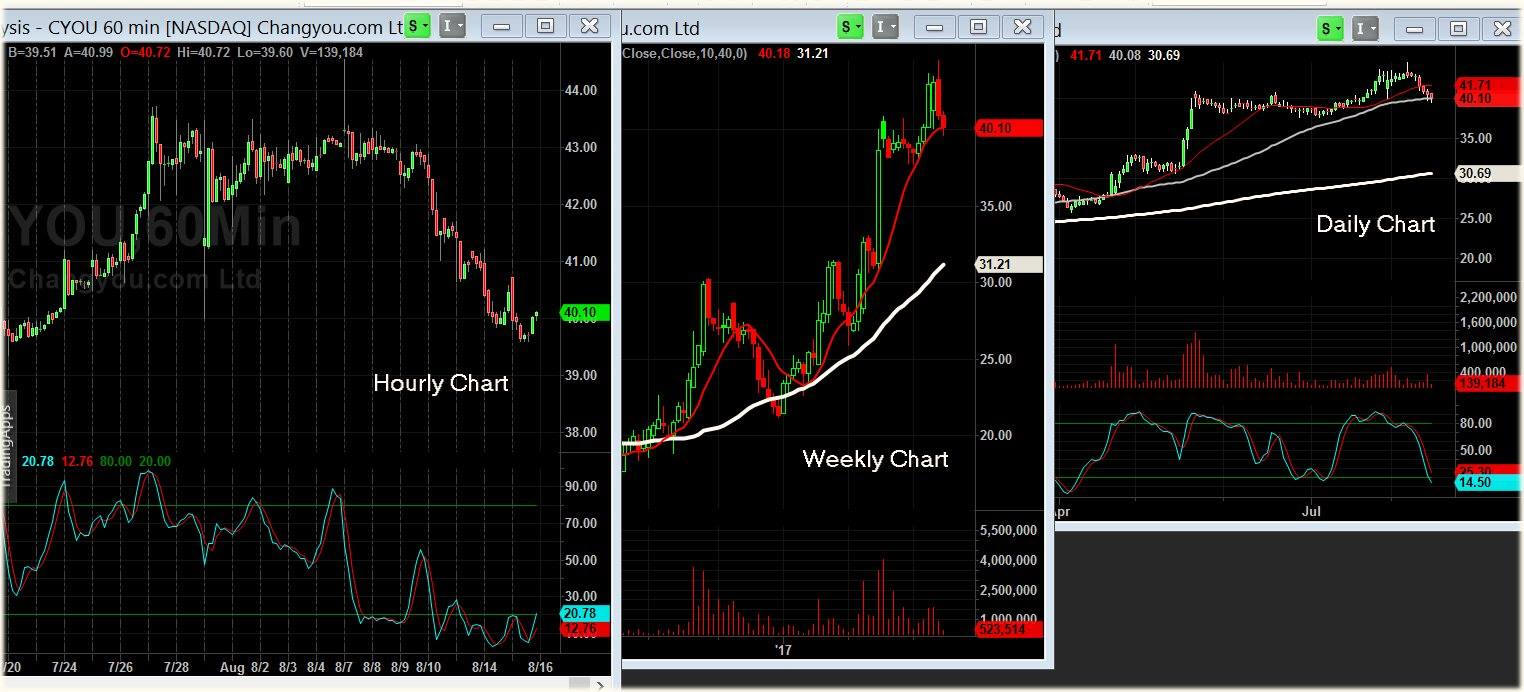
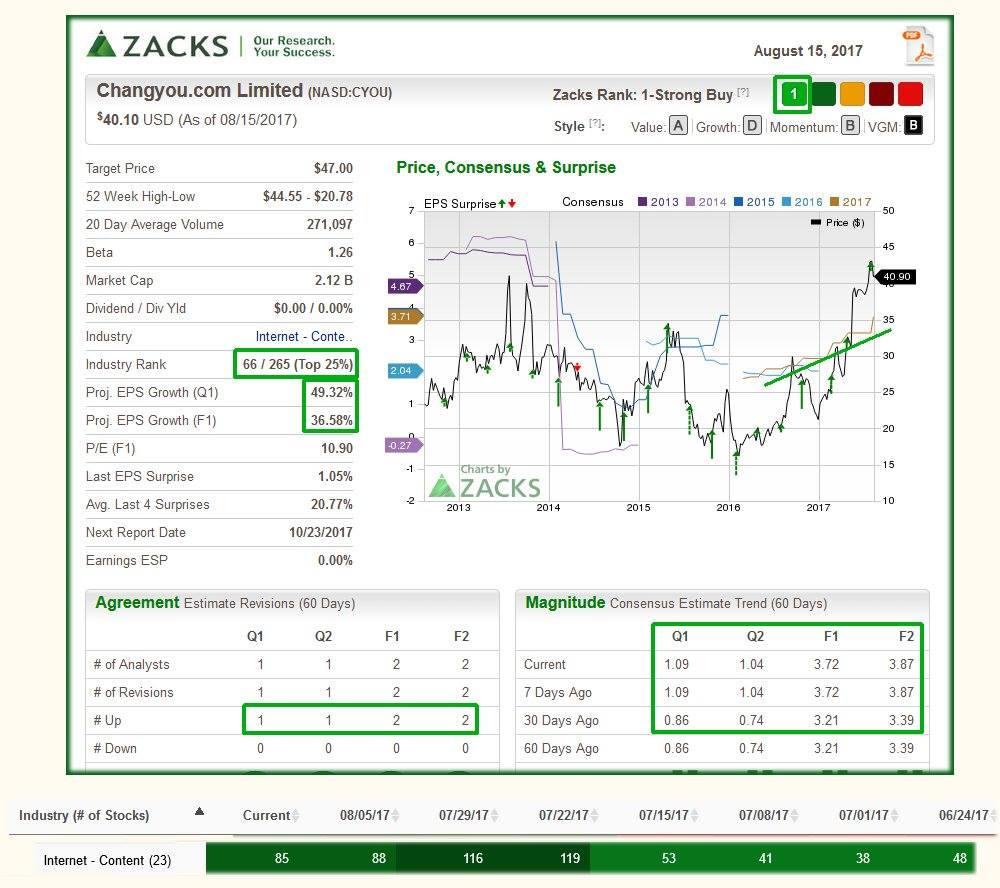
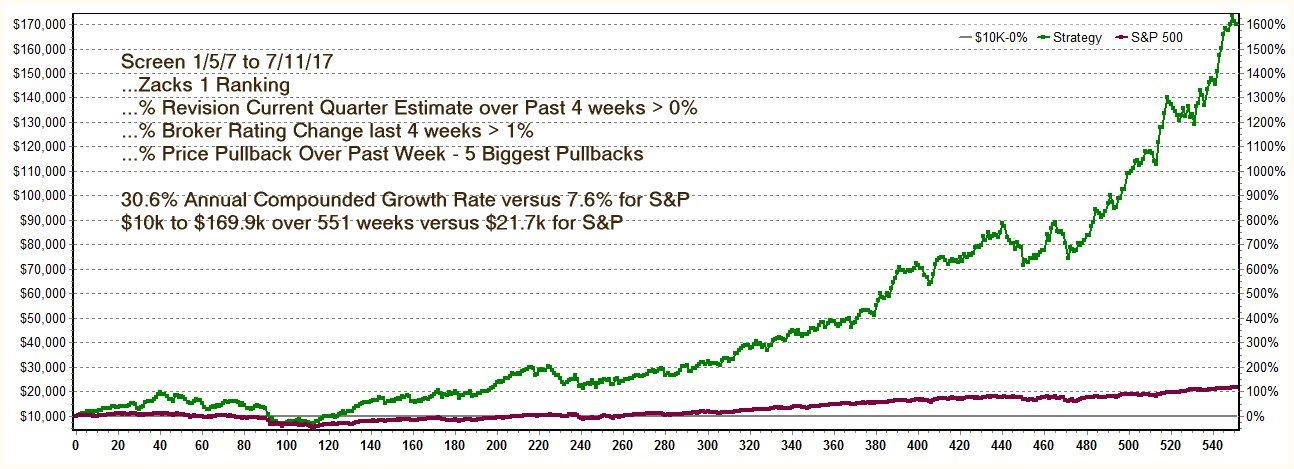
_________________________ 08/15/17...I like TSM's CYOU here: fundamentals remain good with upwards earnings revisions over the past 30 days; technicals show a classic multi-day pullback into an area of support. The third chart shows the results of a screen highlighting these same features: Zacks 1 rankings, increase in quarterly earnings estimates, positive brokers average rating change combined with a 1 week pullback. Result: 30.6% annual compounded rate of return versus the S&P's 7.6% for a 1 week hold period over 551 weeks between 1/5/07 and 7/11/17. Note, the scan run this evening produced three TSM stocks: NTRI (holds membership in 11 of my 52 screens), SODA (6 screens) and CC (10 screens).
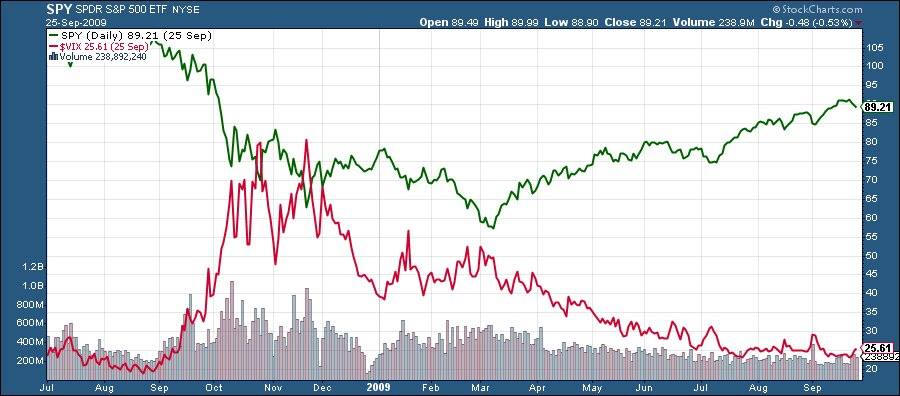
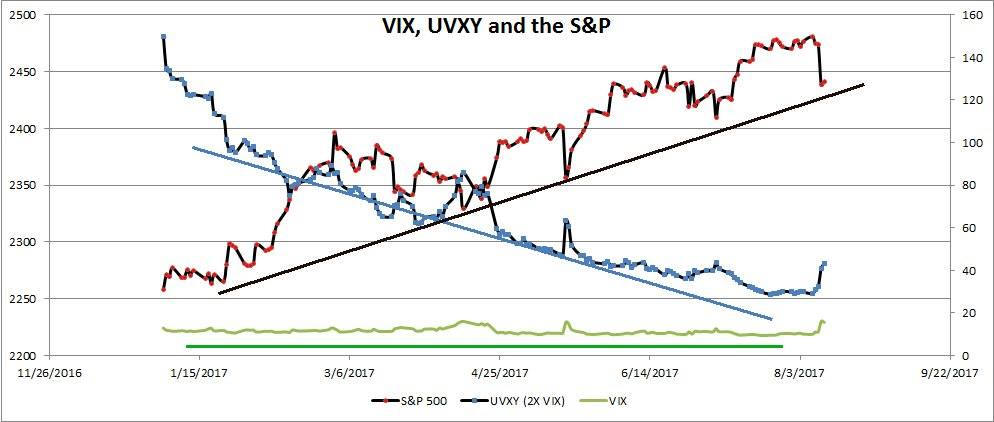
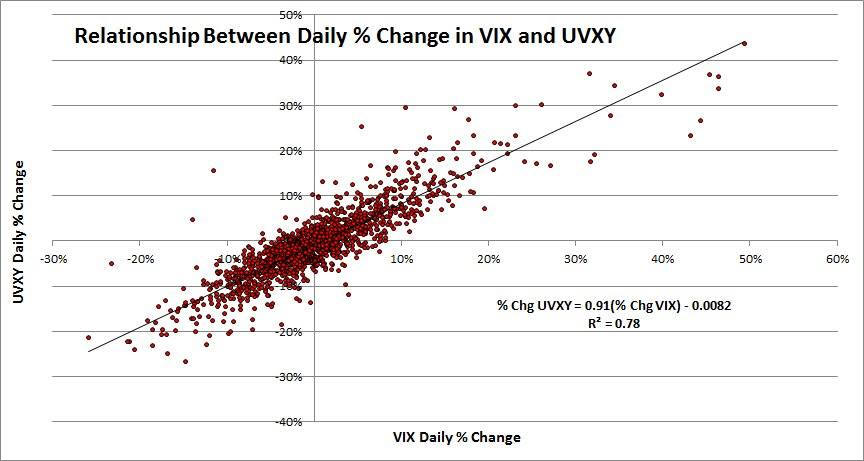
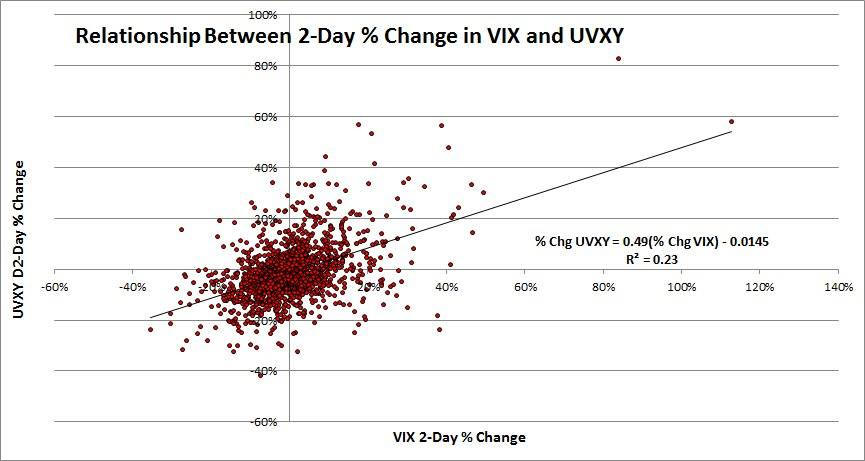
_________________________ 08/12/17...One short-term hedge that I like to use in these uncertain times is the fear index, i.e., the VIX (the implied volatility of the S&P 500 index options), or more specifically its 2x construct, the UVXY. It's meant to be a very short-term hedge, maybe over a couple of days, not to be held over the long term. The first chart shows how the S&P, the VIX and UVXY have performed this year: while the S&P has steadily moved higher and the VIX sideways with occasional bumps higher, UVXY has steadily fallen -- that's the nature of this beast and the reason it cannot be held over the long term. UVXY is constructed from the front two months of the VIX futures. As such, it's priced at a premium to its underlying's spot price. Too, like all futures (and options), it's a decaying asset, hence the steady drop in price as these futures expire and get replaced. The second chart shows the relationship between the daily change in the VIX and UVXY, since the latter's inception on 10/4/11. Clearly it's a direct one, but interestingly, its not a 2X relationship. The slope at 0.91 performs at slightly less than a 1X relationship, i.e., when the VIX changes by 1%, the UVXY has changed by 0.91%. The third chart shows the relationship between the 2-day change in the VIX and the UVXY. This relationship is much less certain, not surprising since the UVXY is constructed to reflect daily changes, not over a longer period. The last chart details the relationship between the daily change in the S&P and UVXY. Since 2011, 22.3% of the time, the two moved in the same direction, but 77.7% of the time they move opposite to one another. On average, the % change in the UVXY has been -2.9 times the % change in the S&P (the median -7.2 times). Clearly, as the S&P drops, fear builds, and UVXY increases. Anyway, as fear increases with the Korean situation, the VIX and the UVXY are moving higher (5.8%, 5.2%, 26.7% and 5.3% in the past four trading days). My 2,000 shares are up $9,600 in two days, but they could fall just as quickly.
_________________________ 07/29/17...Zacks Stephen Reitmeister goes over three key lessons he has learned over his 35 years of investing. https://www.zacks.com/stock/news/269779/35-years-of-investing-wisdom-in-5-minutes _________________________ 07/29/17...The HD Covered Call...HD is a longer term trade. Technically, it's rebounding from an 8-week pullback to the support area of its 200-day moving average. It's pullback has been in response to the fear that Amazon will make inroads into its market. Currently, I own 700 shares. Fundamentally, I like HD's steady increase in its earnings as shown by the consensus earnings' gaps between years in the chart and the upward slope within each year. Its only real negative is that its industry is currently out of favor. While you're holding shares, you can get a nice return by selling out-of-the-money Calls. For example, assume at Friday's close that you bought 100 shares at $147.66 ($14,766). You could have then sold the $149 Call expiring next Friday for $0.58, which equates to a 0.39% return over 7 days or 20.5% annualized if you did it every Friday. Say during the week, you bought the Call back for $0.05, that would reduce your annualized return to 18.7% (slightly less because I would spend $2 of the $53 I received for commissions). My ideal trade would be that HD rose to $150 at next Friday's close. Just before the close, I would buy it back and write the next week's Call or just let it expire and write the Call Monday morning. Usually, the impact on time (the weekend) on the Call takes place Friday afternoon. Anyway, it's a nice vehicle for getting a decent return on your cash. Too, four times a year, it will give you an additional dividend of at least $89 now but very likely to grow substantially over the years. Let take a look at some of the Greeks for the $149 Call. Delta, at -0.324, tells me that its volatility characteristics would lead one to estimate a 32.4% probability that the $149 Call will finish in the money, and the position will trade as if I were holding 67.6 shares (100 for the stock and -32.4 for the Call - a negative Delta corresponds to a short stock position), which will grow more negative as HD's price rises. Theta, at +0.0828, estimates that the Call will gain $8.28 each day as time passes (too, Theta will grow if price rises); Vega, at -0.0693, estimates that I will gain $6.93 for each percentage of Implied Volatility lost. Gamma, at -0.1256, estimates how much Delta can be expected to increase as HD's price increases $1 (as HD's price rises, there is a greater probability that the $149 Call will finish in the money). For a Covered Call, I would prefer these Call characteristics: Delta small, Theta large, Vega large, Gamma small and Implied Volatility large compared to its 6-month range. I will make money as HD's price rises, as time passes and as its volatility drops. Finally, let's look at another interesting option characteristic: the Strike of Most Pain for those owning the HD's option string expiring next Friday. At next Friday's closing price, all long Calls below that price will finish in the money, while those at that price or above will finish worthless; all long Puts, on the other hand, will finish worthless at or below that price and in the money above that price. The Strike of Most Pain is that closing price where those long Calls and Puts as a group lose the most money, and conversely, those short make the most money. Since market makers are on the short side of most of these options, it behooves them to do all they can to force HD's closing price to this point of max pain. Next week for HD, they would prefer it close between $149 and $150. That estimate is verified by the move that market maker's are pricing into HD by next Friday's close: the sum of the at-the-money Call and Put (~$1.04 + ~$0.98 or ~$2.02 to between $145.64 and $149.68).
_______________________ 07/23/17...Taking Small Losses...Once you have a strategy that's time tested, like TSM's (trading/investing in fundamentally sound stocks with an institutional following), properly handling your losses will determine whether you're profitable or not. I try to live by the statement: the best loss is usually the first one, i.e., don't let small losses turn into portfolio busters. My biggest losses invariably result from violating this one rule. Cramer...It only takes one or two losers to wreck a portfolio. Cramer devotes significantly more time to analyzing the losers than the winners, because the winners tend to take care of themselves. That is why he recommended that investors take the loss on a stock before it gets hideous. _________________________ 07/22/17...Writing Short Puts...Printing money: AAOI's option premiums are so high, it's really like printing money. Take a look at some of its short put opportunities. AAOI closed Friday at $90. It reports earnings on Thursday, the 3rd, after the close. Look at its implied volatility chart, the gold line. At over 100% in July, it's the highest it's been all year, and that's why the premiums are so rich. If I sell Puts, I'll make money if AAOI's price rises (and stocks trading in the $90 range tend to reach $100). I'll make money, too, if it's volatility falls (not as likely running into its earnings report). Finally, I'll make money as time goes by, even if the price doesn't rise (options are a wasting asset).
I'll write 10 Aug 4th $70 Puts for ~$1.50 ($1,500 in premium), which will
expire in 12 days. That gives me $23.89% downside protection and a 58%
annualized return on the $68,510 required to back the position.
A few observations: ...The market makers have priced in a $15 move from its current $90 price into the earnings report (sum of Call and Put at-the-money premiums). ...The +0.141 delta for the $70 Put says that if AAOI's price rises $1, this 10-contract position will make $141; note, the signs of the Greeks are reported in a brokerage statement assuming options are being bought; their signs reverse when the options are being sold. ...Delta also tells me that this short Put position trades as if I were long 141 shares. ...Theta at +0.209 tells me that when one day passes, even if AAOI's price doesn't change, I'll make $209. ...Vega at -0.0377 tells me that I'll make $38 for every percentage point that AAOI's volatility drops, i.e., if it were to revert to its 70% level, I would make ~$1,100. My point is that this option is poised to make money in a lot of different ways: AAOI's price goes up, time passes or its volatility reverts (truthfully not likely to happen as it approaches its earnings report date, though the mean reversion is very likely after the report). ...Finally, if you want to reduce the cash required for this position, you could turn it into a spread. For instance, you could buy the $60 Put, which reduces the premium to $880, but lessens the cash required to $9,120 for a completely cash backed position. ...Most of those trading spreads concentrate on the directional component of the trade and its lower cost and aren't aware of the changes in their associated Greeks, which are additive: Delta drops to 0.08 (0.1409 - 0.06) so you don't get as much bang for your buck as AAOI's price rises (now the position trades as if I'm long 80 shares). Theta similarly is reduced to 0.089 and Vega to -0.0047. All these hurt the short-term profitability of the position and force one to hold it to expiration. Anyway, this position looks like it prints money.
__________________________ 07/22/17...The combination of Zacks rankings, recent upwards earnings revisions and a low Price-to-Sales Ratio provides a stock powerful fuel for price movement, even over a 1 week hold period. Between 1/4/2008 and 7/7/2017 (497 weeks) an average weekly holding of 2.8 stocks produced a compounded annual return of 39.5% taking $10,000 to $241,000, while the S&P produced a 8.2% compounded annual return taking the $10,000 to $21,000. The first with a 34% max draw down and 68% win rate and second with a 51% max draw down and 59% win rate. Interestingly, this year, this screen's results have been falling, likely because value stocks, evidenced by the low P/S ratio constraint, have been more out of favor.
If you drop the P/S constraint, the compounded annual growth rates drops to
15% (280% total return) with 47.3% max draw down and an average of 16.5
stocks held. This is definitely a value oriented screen with the P/S
constraint included.
This screen's pick for next week is WHR, which again is not very interesting in today's market. This screen will probably prove valuable again when the market begins to pullback.
__________________________ 07/21/17...Shawn Doyle - just wondering why you picked HD for tomorrow (TSM Report). Was it due to the new AMZN will be selling Kenmore appliances hit? I don't see HD in any of the daily watch lists, and when I look on the main spreadsheet I'm not that impressed. Zacks 3, low industry ranking, VGM B. What made you pick HD?
My Answer...A 2A Zacks ranking is very good
for such a large cap stock. What I like best is HD's steady growth in earnings.
The TSM buy recommendation is just above the support of its 200 day moving
average, as this is where institutional support will come in big time.
HD's steady growth in its dividend is another reason to like this stock.
__________________________ 07/19/17...Picking Stocks to Trade Intraday...When I can watch the market in my brokerage account, I'll sort the current week's TSM list of stocks (194 this week) by % change. I'll then look at those with the largest negative changes (pullbacks - my favorite) and the largest positive changes (breakouts). Frequently, these will result from responses to an earnings report, an analyst estimate revision or change in ranking or other news. I'll then do the following:
1. Check the news to find out as much as I can as to why the change;
2. Look at the charts (1 min, hourly, weekly and daily) for entry points; 3. Look at the Zacks Fundamentals (rankings, industry performance, earnings revisions, PSC chart); 4. If everything looks promising, I'll enter a trade on the rebound from a pullback. As examples this morning, I bought LAKE and CSX (gap down on good earnings report). For LAKE, I bought 2,000 shares ($14.65) when the slow stochastics triggered an entry (blue line cross back over red line and over the 20% level) and then sold 16 min later at $14.90 for $500 profit less $40 commissions. LAKE went on to reach $15.65 14 min later before pulling back again. News on LAKE: https://www.zacks.com/…/7-stocks-near-52week-high-with-more… I also bought 500 shares of AAOI ($92.75), as it pulled back to its intraday support, and then sold 30 min later at $93.44 for a $345 profit less $10 commissions.
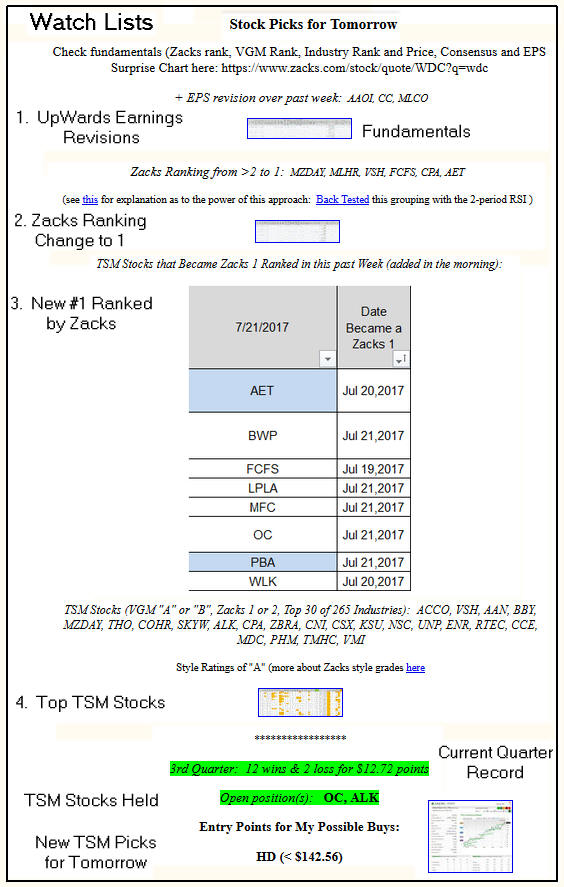
__________________________ 07/19/17...Picking Stocks to Trade...Each night I create TSM watch lists comprised of stocks that had: an upward earnings revision over the past week, a Zacks ranking change from >2 to 1 over the past week or attained a new Zacks 1 ranking over the past week. Additionally, I create a list that have a Zacks ranking of 1, a VGM style ranking of "A" and holding membership in a top 20 performing industry. These are the best of the best, a grouping I call Top TSM stocks. I've made 60 Top TSM stock trades (35 wins, 10 losses and 15 still active) this year for a profit of $13,383. The stocks traded were: ADI, ALK, AMAT, BBY, CC, TER and UCTT. Trading fundamentally sound stocks increases one's odds of having a profitable trade.
When I trade, my goal is to trade just fundamentally sound stocks. Those are
the ones of interest to institutional traders who comprise 80% of each day's
trading. I'm not interested in tips, in magazine or tv business show picks
or the picks from seemingly innumerable emails marketing a stock picking
program or service. Just compile a list of fundamentally sound stocks with a
trend of increasing earnings revisions in a top performing industry, then
look for a technical entry point.
This chart shows a portion of the TSM nightly report that emphasizes the four nightly produced watch lists and the pick(s) for the next day, as well as the currently held positions. In most cases, a list of fundamentals accompany the picks.
__________________________ 08/18/17...Ken Fisher "How to Figure Out What's Next for the Economy in a Few Easy Clicks" https://www.usatoday.com/story/money/columnist/2017/07/17/how-figure-out-whats-next-economy-few-easy-clicks/479617001/ __________________________ 07/15/17...So Why Isn't Everyone Selling Puts?...From a recent Motley Fool Report... So Why Isn't Everybody Selling Puts? You might be wondering: If it's so easy, why don't more people do it?
Well, the simple answer is that they're afraid they'll end up owning the
shares. You see, with put selling, if the stock drops dramatically, you end
up buying the shares at the strike price you agreed to when you sold the
option -- but you still keep the income the put options paid you, so your
cost basis on the stock is even lower than the strike price!
And that's the big mistake that most people make with put selling. They do it on stocks that they would never want to own! With TSM stocks, usually if your are forced to buy the shares, it's at a much better price, for a fundamentally sound company, than you could buy the shares today. As shown in the attached table, through the first half of 2017, I made 52 short-Put trades, averaged being in each trade 7.6 days and made $10,712 in premium (after commission) or about an extra $1,785 each month. On average, these trades required $42,445 to be 100% cash backed in my IRA. Let's say you had a $100,000 account and did six of these trades each month (2 trades every 8 days), it should be possible to generate $1,242 on your $100,000. Of course, sometimes the money will be tied up over longer periods; other times shares will be put to you, but on average, you should be able to generate a good return. The key is to be sure you're dealing with quality stocks.
__________________________ __________________________
 | ||||||||