TripleScreenMethod.com
Consumer Spending and Market Health
from www.CANSLIM.net (published March 2006)
Richard W. Miller, Ph.D.
During the past year, I have published several TSM (and CANSLIM.net) articles discussing various measures of market health: sentiment product (
12/27/05), the “amazing 200” (12/02/05), the put/call ratio and the VXO (7/15/05), the yield curve (2/20/05), and the percent of NYSE stocks with bullish point & figure charts (1/03/06). These, for the most part, technical readings taken across the breadth of the market forecast when the market is healthy and, more importantly, when it’s turning.This month, I discuss another economic measure—consumer spending—that fuels the market. Consumer spending drives corporate earnings, which in turn, drive stock price. It’s important to the trader/investor for two reasons: real consumer spending (inflation adjusted) is a leading indicator of market health (and as such the stock market), and it now can be usefully forecasted thanks to the recent work of Joseph Ellis (“Ahead of the Curve,” subtitled “A Commonsense Guide to Forecasting Business and Market Cycles.”
The chain of events in the economic cycle makes perfect sense to even the non-economists among us: real consumer spending (RCS) accounts for 70% of GDP; it’s directly related to the average hourly wage; as RCS picks up industrial production increases to meet the increased demand; at some point capital spending increases, jobs are created, corporate profits rise, and stock value follows. The pattern results in the commonly known expansion side of the business cycle. While this flow makes perfect sense, it’s been difficult to forecast. It’s easily seen with the benefit of hindsight but murkier in real time.
Ellis, ranked as Wall Street’s #1 retail analyst for 18 consecutive years, argues that current forecasting models fail because recession measures (defined as two successive quarters of GDP decline) serve as the primary indicator of economic harm, and second, data is tracked on a quarterly or month-to-month basis. The first causes economists to miss market inflection points. By the time a recession is identified, the market has long since fallen back and, in fact, is probably ripe for its next expansion phase. The second adds unnecessary noise to the whole process and makes the information unduly difficult to use.
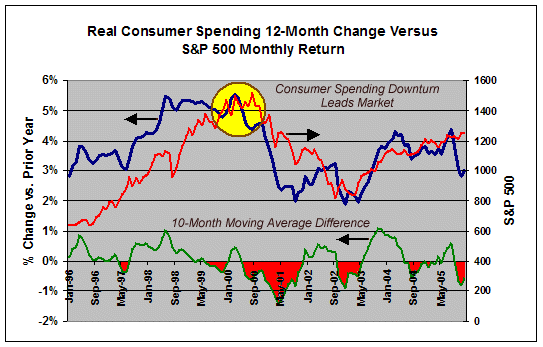
Real consumer spending lies at the heart of the process. Its growth measured as the 12-month rate of change of a three-month moving average is illuminating. A slowing of the growth in RCS has preceded nearly every bear market (13) and every recession (9) since 1950. Invariably a slowing of RCS from the 5-6 percent rate to the 2-3 percent (or lower) has signaled a bear market (defined by a 12 percent or more drop in the S&P), and just as assuredly, the conventional measure of recession has occurred after the S&P's fall (when the RCS rate has begun to pick up again). The chart highlights the 2000-2001 bear market. It shows the 10-year value of the S&P 500, the growth rate of RCS, and the difference of this last from its 10-month moving average (my construct). Note, the last is highlights transitions. Deviations from a moving average highlight change in the moving average’s model of the system.
The area encircled clearly shows the slowdown in RCS preceded the turndown in the S&P. Similarly, its 10-month moving average difference (RCS – its 10-month moving average) shows things have worsened there. The economic climate improved in early 2002 and again in May 2003. Where to from here? RCS has dropped precipitously over the past few months. Can the market be long to follow?
I highly recommend Joe Ellis’ book and his free website (www.AheadoftheCurve-theBook.com) with its updated charts. His fresh approach allows one both to understand which economic data are important at the various stages of the economic cycle and to use that data to forecast market health. There you have it, economic, market breadth and sentiment indicators. Together, they enable one to better identify turning points in the market.