TripleScreenMethod.com
Another Harbinger of Market Health: “Sentiment Product”
Richard
W. Miller, Ph.D.
( CANSLIM.net
)
There are two broad technical approaches to market forecasting: metrics characterizing some feature of the market’s breadth and metrics assessing market psychology or, as more commonly known, the market’s sentiment. Over the past year and a half, I’ve been developing approaches to both.
In the past couple of months, I’ve described the "amazing 200," a new measure of market breadth that can be used to identify bullish and bearish market temperaments, i.e., to identify times when one can enter the market swimming with the current versus times when one’s forced to swim against it. Essentially, this metric tracks a construct of the number of liquid stocks trading below their respective 200-day moving averages. It provides a measure of what’s happening to the breadth of the market, usually in alternating, longer-term trends of more than 90 days.
In addition to following what’s happening to the breadth of the market, however, it pays to know how traders currently feel about the state of the market, since most, selling out of fear and buying out of greed, do so at exactly the wrong times, i.e., the first at the market’s low and the second at the its high. In this report, I’ll detail an approach designed to categorize such market sentiment. The approach utilizes two well know measures of market sentiment: the CBOE equity Put/Call ratio and the OEX volatility index (VXO, formerly VIX).
The underlying premise for both measures has been that exceptionally high or low readings reflect emotional extremes among traders, and, thus, should correlate to bottoms and tops in the market. Basically, the put/call ratio is a simple ratio of the total number of puts that have been traded that day at the CBOE divided by the total number of calls traded. When the market is falling, traders buy puts; hence, the ratio increases. Conversely, when the market is rising, traders buy calls, and the ratio falls. When this ratio becomes extreme (and the definition of extreme has changed over time), it usually marks a reversal in the course of the market. High values of the ratio, for example, are bullish in a contrarian sort of way.
The VXO, also compiled by the CBOE, is the implied volatility of the S&P 100 (OEX) options. Essentially, implied volatility is the market's current estimate of its future volatility, i.e., it’s reflective of where the smart money thinks the OEX will trade over the immediate future. It correlates directly with option premium. During market declines, volatility rises because traders hedge their positions with puts, and put sellers demand more for their perceived increased risk. Conversely, at lower levels of risk, complacency sets in and OEX option premium (and its implied volatility) falls. Again, extreme values have historically marked reversal points in the market.
The underlying premise of both these measures is that extremely high or low readings reflect emotional extremes among investors, and, thus, correlate to bottoms and tops in the overall market. High implied volatility and a high number of puts traded reflect pessimistic sentiment (fear) that marks bottoms, and low volatility with a preference for calls reflects a bullish sentiment (greed) that marks tops.
Sentiment work to date has, for the most part, utilized these measures to identify and then take advantage of short-term overbought or oversold conditions: see Larry Connor’s article, “The Battle Plan Returns,” which develops a successful short-term trading strategy based on the VIX, and David Burkey’s article, “Tracking VIX Swings,” in the Jan ’06 Active Trader, which details market behavior following 10-, 20-, 40-, 60- and 120-day lows and highs in the VIX. Unlike theirs, which utilizes spikes in sentiment, my approach has been to take advantage of its changing trends. Here, I'll present a measure (I call "Sentiment Product") that makes use of the changing trend in sentiment.
Jay Kaepple described a profitable strategy utilizing sentiment trend. In an article published in the August 2004, issue of Active Trader entitled “The Put/Call VXO.” Jay described a sentiment indicator constructed from the two common measures of sentiment. Essentially, for both indicators, one takes 10-day and 65-day moving averages, divides the first by the second to normalize the data, and then uses the simple average of both of these ratios to trigger entry and exit points for the market. Contrasting a short-term moving average against a longer-term one in the construct of their ratio, not only normalizes data of widely different magnitudes, but also picks up changes in trend.
He recommended buying the S&P 500 when this average ratio fell below 1.10 after previously rising to 1.10 or above and selling when it rose above 0.90 after falling to 0.90 or below. In 13 trades over a six-year period (12 profitable) between 1997 and 2003, his approach generated a +148% return.
I’ve tweaked Jay’s approach by taking the product of the two measures rather than their average. For this product to form a maximum, the two measures must be in phase with one another, reinforce one another if you will, and this added requirement ensures the changing trends in sentiment are accentuated, hence, more accurately detected.
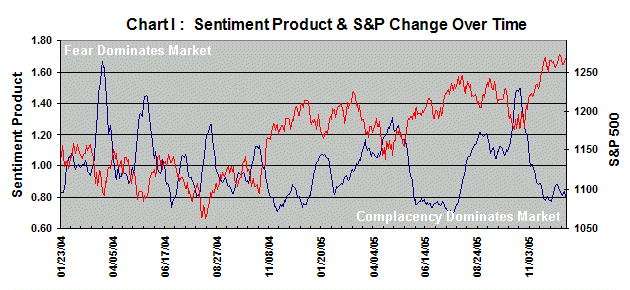
Chart I shows how the sentiment product (blue line) moves inversely to the S&P 500 (red line) over the 480 trading days between 1/23/04 and 12/2305. As the sentiment product rose, fear began to dominate the market as it fell. Conversely, when the sentiment product peaked and began to fall, complacency dominated the market when sentiment reached an extreme.
Chart II, a plot of the change in the S&P versus the change in the sentiment product, shows that falling sentiment (negative values) leads to positive S&P returns (green bubbles whose size reflects the length of the run), and conversely, rising sentiment (positive values) leads to negative S&P returns (red bubbles). Note: The encircled numbers indicate the length on the run in days.
Over this period, there were 12 positive runs (235 days in total), ranging from 9 to 39 days, interspersed with 13 negative runs (242 days in total), ranging from 6 to 45 days. The first generated +462.5 S&P 500 points (+40.6%), while the second dropped –247.7 S&P 500 points (-21.3%). Compare that to the 127.1 points (+11.1%) earned by just entering the S&P 500 and staying put. Clearly, there is an advantage to utilizing the Sentiment Product to define prevailing market trends, market health if you will.
One can use the sentiment product in at least two ways: (1) to define times favorable for trading stocks long versus times favorable for trading stocks short (or staying out of the market all together) and (2) as a trigger to shift between S&P funds and bond funds available within a 401K plan. One could even double the impact by using the sentiment product to trigger entry/exit points using two Rydex funds: Tempest (RYTPX) constructed to move 200% inversely to the S&P versus Titan (RYTNX) constructed to move 200% with the S&P. In a future article, I’ll deal with the combination of the sentiment product (market sentiment) and the “amazing 200” (market breadth): the first defining shorter-term trends in the second.
Market Falling Market Rising Begin End Trading Days Rising Sentiment Product Change Change in S&P 500 Begin End Trading Days Falling Sentiment Product Change Change in S&P 500 1/23/04 2/6/04 11 0.21 1.21 2/9/04 2/20/04 9 -0.06 4.3 2/23/04 3/19/04 20 0.62 -31.21 3/22/05 4/27/04 26 -0.78 42.71 4/28/04 5/17/04 14 0.5 -38.31 5/18/04 6/29/04 29 -0.69 44.71 6/30/04 7/15/04 11 0.27 -34.15 7/16/04 7/30/04 11 -0.27 0.38 8/2/04 8/17/04 12 0.44 -24.91 8/18/04 9/20/04 23 -0.45 27.03 9/21/04 10/20/04 22 0.3 -25.64 10/21/04 11/18/04 21 -0.42 77.06 11/19/04 12/8/04 13 0.12 12.47 12/9/04 12/23/04 11 -0.15 20.89 12/27/04 1/20/05 18 0.31 -29.51 1/21/05 2/8/05 13 -0.25 34.43 2/9/05 3/21/05 28 0.3 -8.21 3/22/05 4/7/05 12 -0.12 19.43 4/8/05 4/27/05 14 0.23 -24.82 4/28/05 6/22/05 39 -0.57 70.66 6/23/05 8/25/05 45 0.44 11.64 8/26/05 9/12/05 11 -0.14 35.46 9/13/05 10/20/05 28 0.4 -53.4 10/21/05 12/2/05 30 -0.72 85.49 12/5/05 12/12/05 6 0.08 -1.66 12/13/05 242 Trading Days -244.84 S&P 500 Points 235 Trading Days +462.5 S&P 500 Points