TripleScreenMethod.com
State of the Market
Richard W. Miller, Ph.D.
Chart II is a plot of the “amazing
200,” a construct of the number of stocks trading below their respective
200-day moving averages—and another indication of the health of the breadth
of the market. It’s zigzag series of bullish (green from left to right) and
bearish (red from right to left) runs has occurred over the past year and a
half. Over this period, the market has been generally bullish, i.e.,
zigzagging up, but when that changes, it will begin zigzagging down through
a new stair-step series of bullish and bearish runs. Note where it finds
itself at the close of 12/30/05. Has the downtrend begun? Time will tell,
but nevertheless, it appears headed into a new bearish run.
There you have it, three independent measures that a signaling or close to
signaling a down turn in the market. Will it happen today, tomorrow, next week?
The three are not that clear yet. Suffice it to say, it’s coming soon.
It’s estimated that over 70 percent of a stock’s price movement is due to a combination of general market trend and its sector/industry strength, and only 30 percent to individual company characteristics. It behooves us to monitor closely both. Here, I’ll discuss the state of the market as we enter the new year. I'll discuss, in particular, what three independent measures (two market breadth measures and one market sentiment measure) are telling us: the NYSE bullish percent, the “amazing 200” and the sentiment product.
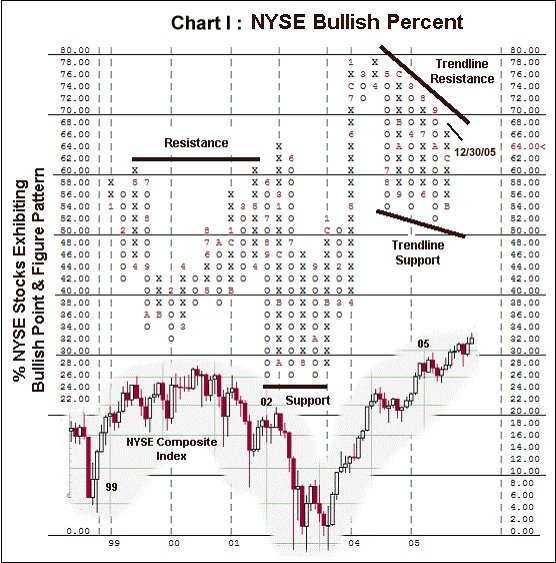
The NYSE bullish percent (chart 1) is a "point & figure" chart. It tracks the number of stocks on the NYSE that are currently giving bullish "p&f" charts. As such, it gives us an indication of the health in the breadth of the market. Note, "p&f" charts are unique in their ability to classify each stock (index or most market indicators for that matter) as either bullish or bearish. The BPNYSE, for instance, is bearish because its last signal was made by the lower column of O’s in October of 2005 (letter A indicates October).
Notice too, the resistance trend line offering resistance at the patterns top--where 78% stocks gave bullish p&f charts--has been falling since April of 2004 (4 on chart). Currently, the market is butting up against this trend line again in its latest column of X’s. If it doesn’t push through, likely the market will form a new column of O’s that could break down to, and quite possibly below, the supporting trend line at 52%, i.e. the percentage of stocks making higher highs (classified as bullish) would fall, as the number making lower lows (classified as bearish) rose.

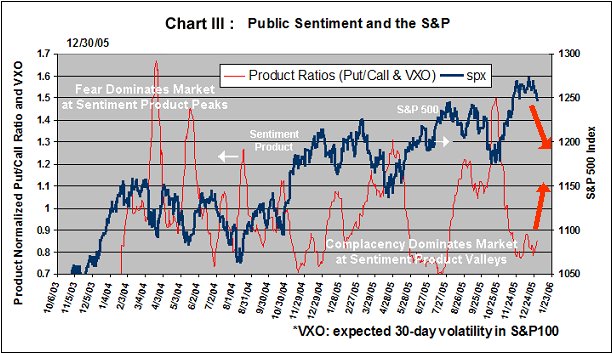
TSM’s third measure is the
sentiment product, a construct of the VXO (OEX implied volatility) and
CBOE’s equity Put/Call ratio. This is a measure of sentiment in the market. As
shown in Chart III, it moves inversely to the S&P, whose 500 stocks capture more
than 80% of the total market cap. As opposed to the first two, which measure
stock performance of the breadth of the market, this one reflects how
traders/investors feel about the market. Invariably it shows that fear controls
a bottoming market and greed one topping; hence the sentiment product is a
contrary measure. Like the other two, this independent measure is bearish, i.e.,
ready to move up as the S&P falls.