 |
Friday,
May 30th, 2008
FEEL FREE TO PRINT THIS REPORT
|
"An Approach
to Successful Stock Trading Combining Company
Fundamentals with Chart Technicals" |
|
Comments or Questions (TSM Service, Methodology, Performance or Your Success Stories)
Go Here
- (rmiller@triplescreenmethod.com)
|
|
- Weekly TSM Qualified Stocks - |
TripleScreenMethod.com
Clearly, real day trading (sitting in front of your computer all day)
is not for everyone. Even so, high priced TSM stocks are good
vehicles. My key is to use relatively few and get to know their
trading personality well. Right now, for me that's POT, AAPL
and MON. All are above $100 a share, trade more than three million
shares daily, and offer at least a 25 cent range in their respective
1-minute bars. Here are a few of the trading edges that I've
developed for AAPL:
-
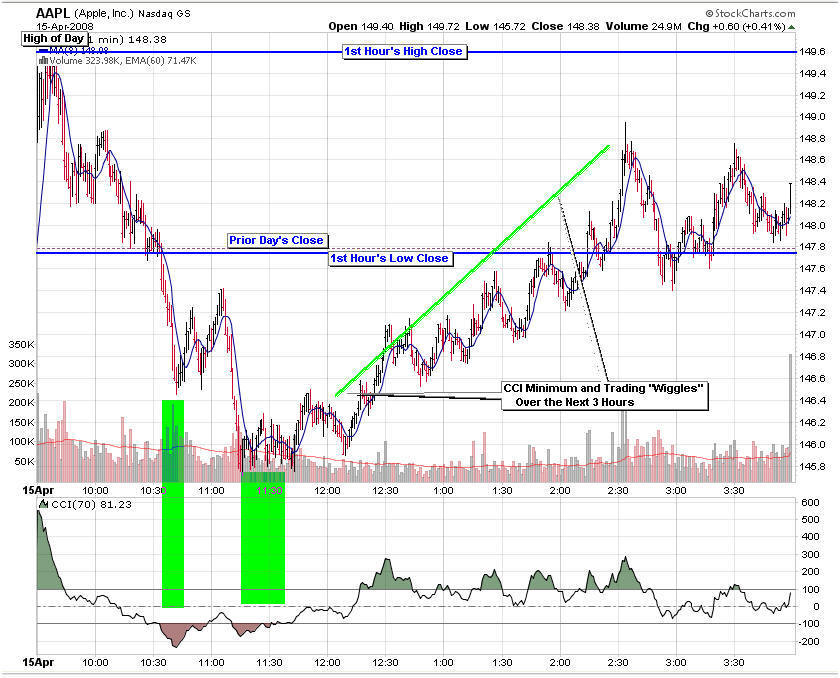
80% of the time
AAPL makes its intra-day high or low in the first hour of trading;
-
the 1st hour's
high and low close (on a 1-minute chart) act as support and resistance;
-
the 70 period
(again on a 1-minute chart) Commodity Channel Index (a measure of the extent
of deviation from the mean) provides high probability entries;
-
the intra-day
range is far greater than the inter-day range.
The TSM approach to day trading these stocks uses ~$100,000 to buy up to 1,000
shares then looks to win ~25 cents ($250) continuously after a high probability
(CCI minimum below -140) is identified. The 8-period moving average is the
buy target. The following two charts demonstrate the approach. Seven
trades were executed in the first when the CCI edge (green areas) presented
itself to generate a $1,215 profit (~1% return on our $125,000 trading account)
for the day.
The next day, the same approach was
used for POT in 10 trades to generate $1,593 (~1.3% return on our $125,000
trading account) in profit.
Finally, look at AAPL's chart on 04/15/08 and the opportunity that presented
itself.
Similar data for AGU show that 95%+ of the time the high or low of the
day is found in the 1st hour of trading. The following chart tracks AGU
through 59 trading days in March through May of 2008 shows the
high (red H) and low (blue L) intraday trading points:
If you're going to day trade like this, get to know a few very
liquid stocks well and develop trading edges.