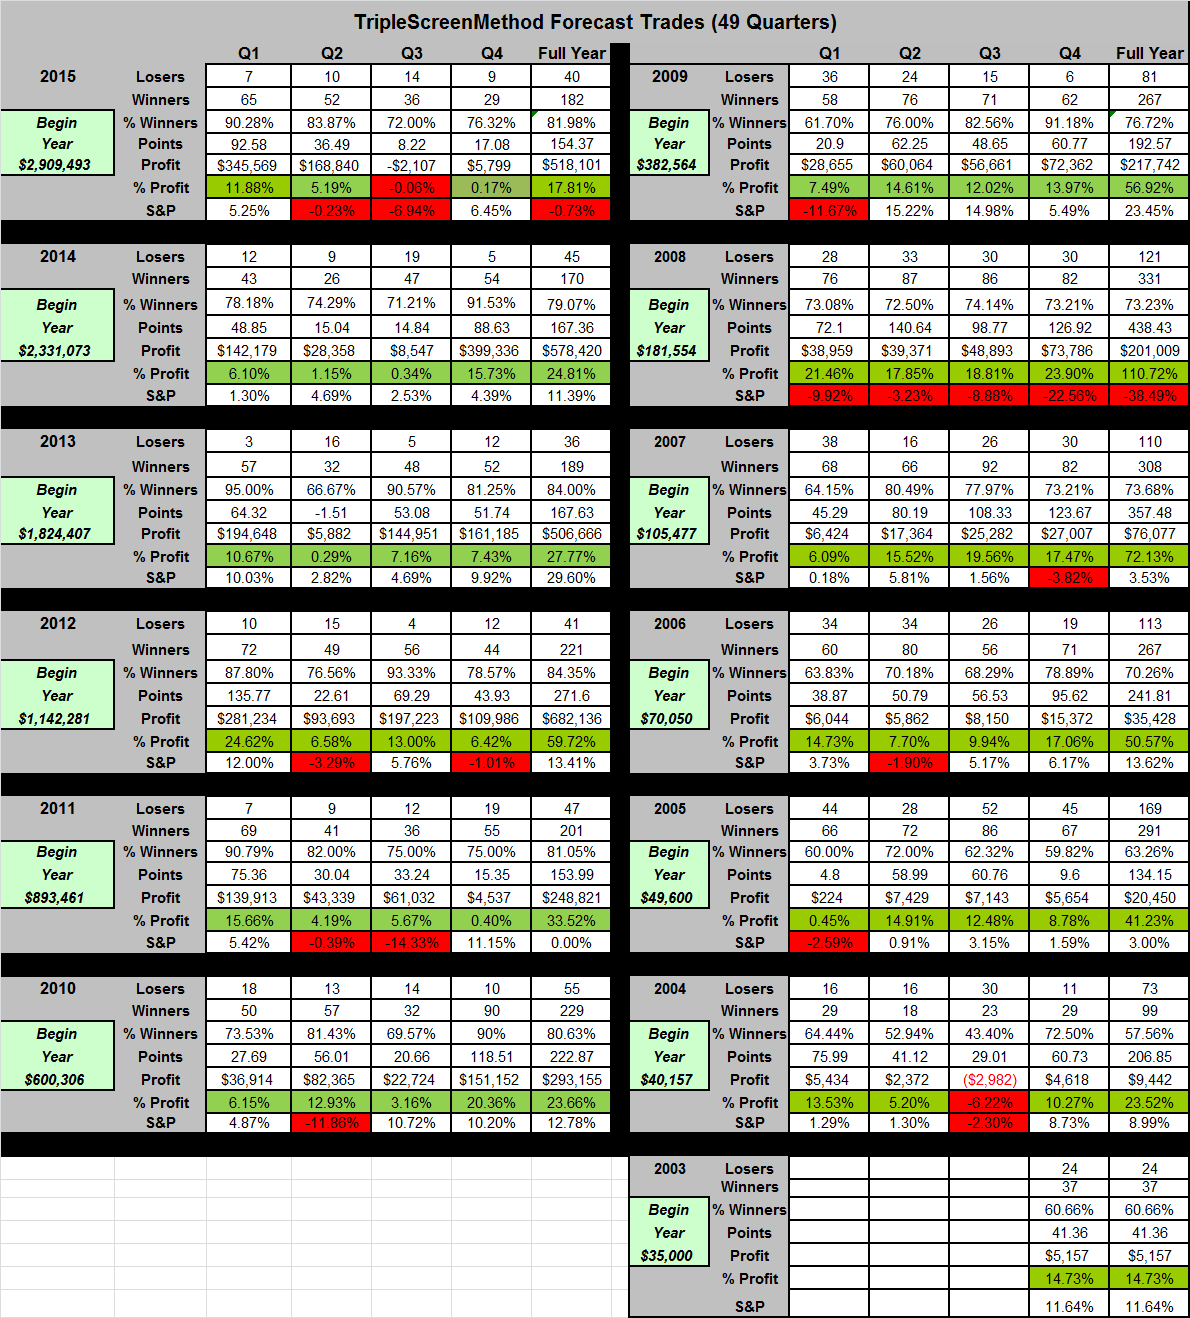
TSM Quarterly Returns for Forecast Trades
TSM utilizes a trading method based on earnings, their stability and their revisions. Over the long term, a stock's price growth is a direct reflection of its earnings. Over the short term, its earnings revisions are a big factor driving price.TSM finished 2015 generating a 17.81% return on 222 forecast 1/2 position trades (182 wins and 40 losses for 82% winners). The S&P, on the other hand, lost 0.73%. On average, each of the TSM trades lasted 10.1 days.
The Quarterly breakdown is shown in the accompanying chart. The TSM forecasts generated 2 losing quarters in the last 49 (a -0.06% in Q3 2015 and a -6.22% in Q3 of 2004). Over the same period, the S&P had 17 losing quarters. Even in 2008, when the S&P had 4 losing quarters (-38.49% for the year), TSM returned 110.72% on 452 1/2 position trades.
Note, I personally didn't make all these trades, though I did make most of them. Think of these returns as profit that would have been available in these forecast trades.
