TripleScreenMethod.com
Trading Pullbacks for Fundamentally Sound Stocks (8/29/05)
During down periods in the stock market (and September is historically the worst month of the year), it pays to watch the market, as well as develop a watch list of quality stocks, in anticipation of the next market turnaround. I still expect the market to take off but not until late October. During this period, I like to analyze our methods and approaches. Today I'll share some of my work designed to improve our entries into and exits from pullback trades.
Two major approaches to trading stocks utilize pullbacks and breakouts. The first offers well defined risk management while the second offers the benefit of no immediate overhead resistance. Here, I share some of the work that I've been conducting with TradeStation to better define the risk/profit characteristics of two common pullback schemes: 5-day minimums and three consecutive lower lows.
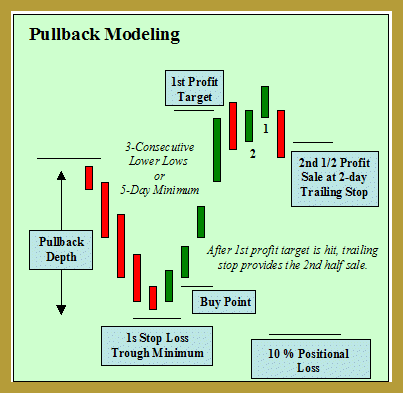
Strong stocks (ranked by earnings and earnings revision fundamentals) that are undervalued, according to their PEG ratios, trend higher with increasing daily highs until selling pressure builds and then overwhelms. Here, owners are taking profit, and short sellers are anticipating an overbought reversal. A multi-day pullback follows, deepening until increasing buying pressure causes the bullish uptrend to resume. A stock undergoing this sequence has a chart that resembles a rising series of hills and valleys (example). The pullback trader buys the pullback at the point it resumes its upward trend.
In this study, twenty fundamentally sound stocks (2 each from 10 major sectors) were back tested over 4.2 years between 6/14/00 and 8/26/05 (1,534 days or a total of 30,720 days for the 20 stocks). The period encompasses extremes in both bullish and bearish pressure, a period over which the S&P lost 19 percent of its value. My aim is to determine the best pullback scheme via both profit and risk (drawdown) criteria for these type stocks.
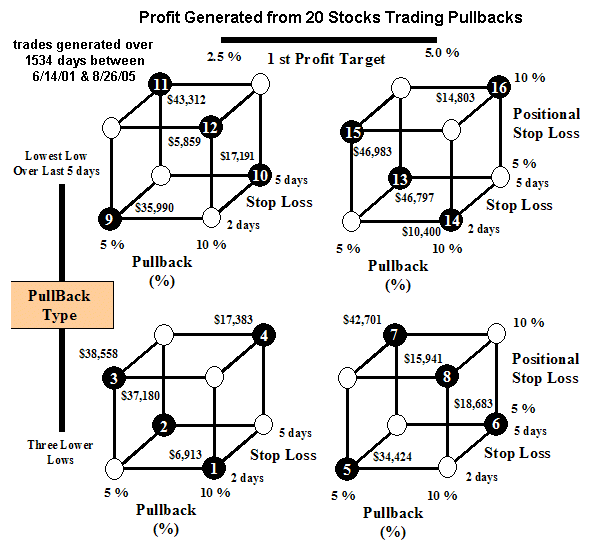
Five factors were explored (two extremes for each) through a fractional factorial characterization: (1) first 1/2 position profit target taken after either a 2.5 percent or a 5.0 percent gain ($0.50 or $1.00 for a $20 stock, $1.00 or $2.00 for a $40 stock, $2.00 or $4.00 for a $80 stock); (2) utilizing either a 5 percent or 10 percent positional stop loss of last resort (like O'Neil's 7.5 percent stop loss where the position is sold out after this stop is hit); (3) either a 2- or 5-day trailing stop for the 2nd 1/2 profit once this stop exceeds the initial stop set 11 cents below the pullback trough; (4) pullback depth either greater than 5 percent or greater than 10 percent defined by the high 4 days ago and today's low; and (5) pullback type, either 3 lower lows or a 5-day minimum. Four factors were held constant for each run: (1) 20-day moving average must be greater than 50-day moving average (pullback from bullish trend); (2) today's price must be greater than its 200-day moving average; (3) today's 50-day moving average must be greater than it was 10 days ago (uptrend); and (4) a 20-day time stop ends positions that haven't been stopped out otherwise. Each trade invested $10,000.
The chart below shows the factor space investigated for the 5 factors and the total profit generated from trading the 20 stocks. Only half the combinations in the space are needed to define factor effects. Least-squares modeling (R2 0.96, edf 10, RMSE $3592) defines the following profit map:
Total trading profit = $27,343 +
+ $ 2,181 (when using a 5.0 percent 1st target)
+ $ 850 (when using a 10.0 percent positional stop)
+ $ 2,414 (when using a 5-day trailing stop for 2nd half profit target)
+ $13,946 (when using a >5 percent pullback depth)
+ $ 324 (when using 5-day minimum pullback definition){for alternate factor settings, reverse the sign of its coefficient, i.e., increasing the selectivity of the pullback depth to >10 percent reduces profit by $13,946}
Profit was maximized by (1) a 5 percent 1st profit target, (2) a 10 percent positional stop, (3) a 5-day trailing stop for the 2nd half profit target, (4) a >5 percent pullback depth, and (5) the 5-day minimum method. This combination would have produced a profit of $44,877 (90% on a $50,000 investment) over a period when the S&P lost 19%.
Sectors and Stocks Used in the Optimization
Sectors (Stocks): Health Services (AMED, CVH), Diversified Services (ASF, NTRI), Manufacturing (ASVI, CAT),
Energy (CDIS, HYDL), Specialty Retail (CHS, URBN), Metals & Mining (HW, POT), Drugs (LIFC, USNA),
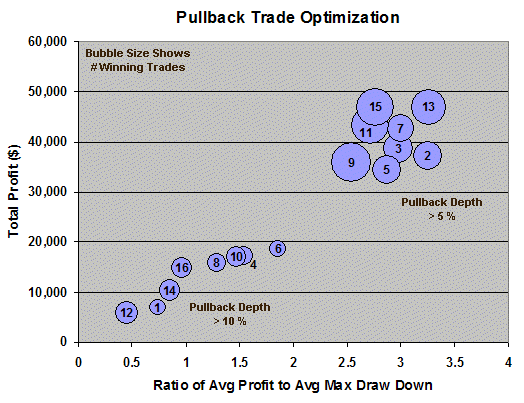
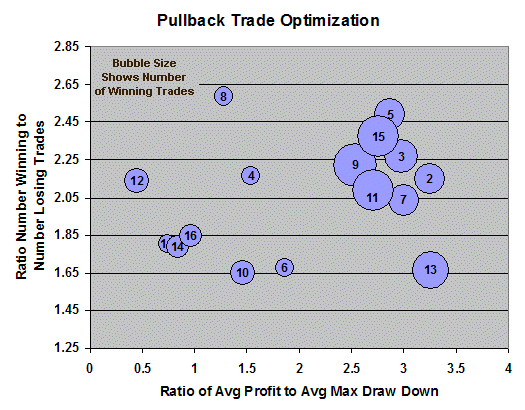
Computer Software (MCRS, QSII), Materials & Construction (MTH, TOL), Consumer Non-Durable (PARL, PVH)The following table documents trading characteristics for each of the 16 sets of conditions identified in the chart above. For example, factor combination 13 generated $46,797 in profit from 335 winning trades and 201 losing trades (a 1.67 win-to-loss ratio), and the average, maximum trade drawdown was $718 producing a 3.26 profit-to-drawdown ratio. Ideally, one would like to maximize profit and maximize both win-to-loss and profit-to-drawdown ratios.
Factor combination 13 offers the best combination of profit and profit-to-drawdown ratio, though the ratio of winning-to-losing trades is one of the third worst. With the exception of the final positional stop at 5 percent, the settings are those described in the above least-squares model. Its average max drawdown at $718 is 1.4 percent of the $50,000 account.
Optimization for Pullback Factors Trade Condition Total Profit ($) Winning Trades (#) Losing Trades (#) Ratio Average Max Draw Down ($) Average Profit to Avg Max Draw Down 1 6,913 85 47 1.81 581 0.74 2 37,180 236 110 2.15 572 3.25 3 38,558 245 108 2.27 648 2.98 4 17,383 93 43 2.16 704 1.54 5 34,424 224 90 2.49 600 2.87 6 18,683 77 46 1.67 627 1.86 7 42,701 216 106 2.04 718 3 8 15,941 93 36 2.58 780 1.28 9 35,990 426 192 2.22 708 2.54 10 17,191 137 83 1.65 652 1.46 11 43,312 399 191 2.09 798 2.71 12 5,859 156 73 2.14 728 0.45 13 46,797 335 201 1.67 718 3.26 14 10,400 129 72 1.79 684 0.84 15 46,983 387 163 2.37 851 2.76 16 14,803 133 72 1.85 856 0.96 The following two charts highlight the relationships in the above table.


