 |
FEEL FREE TO PRINT THIS WEEKEND REPORT
|
"An
Approach to Successful Stock Trading Combining Company
Fundamentals with Chart Technicals" |
|
Comments or Questions (TSM Service, Methodology, Performance
or Your Success Stories)
Go Here
-
(rmiller@triplescreenmethod.com)
|
TSM Stock Performance
Quarter-by-Quarter TSM Results
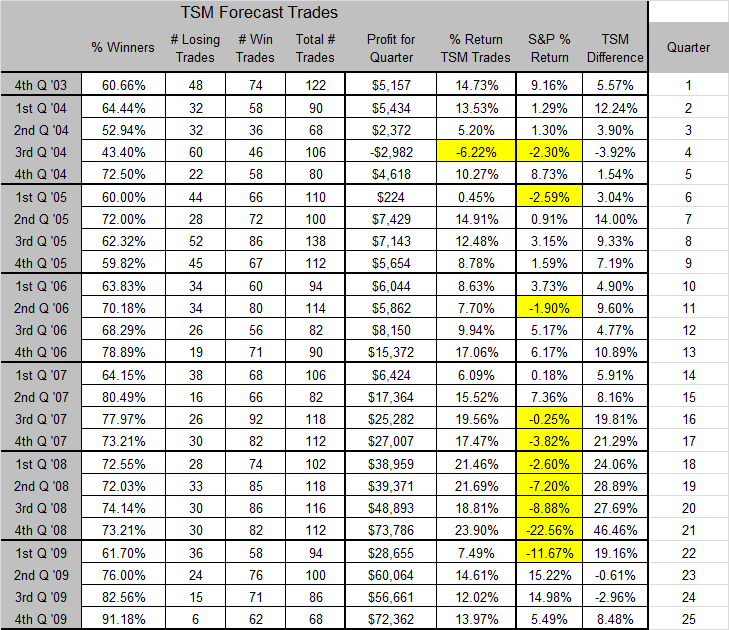
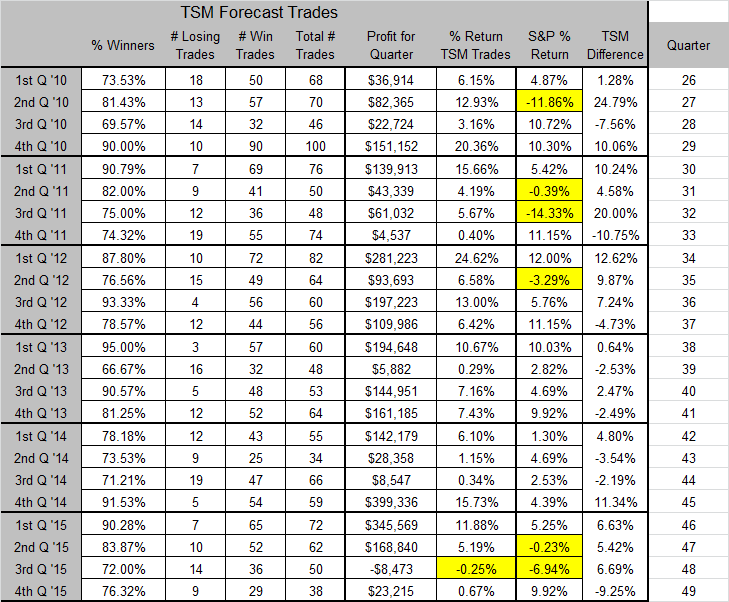
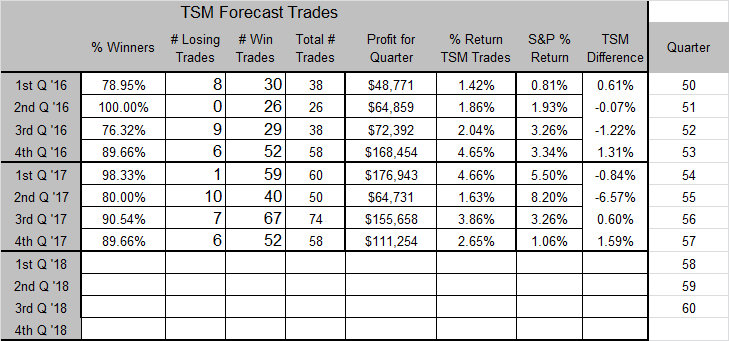
Understand this, though, the TSM daily report forecasts hypothetical trades, i.e., what could be achieved
during the life of the trade, not actual trades. While I do make many of the trades myself, I often don't attain
the maximum profit possible for a given trade (true, I'm sure, for most of TSM's readers) because I don't set at
the computer over the entire time the market's open (usually only the first 1 and 1/2 hours and the last hour). TSM's goal is to
produce a list of fundamentally sound stocks (mostly in the $500 million to $10 billion market cap range) that
have earning's revision fuel to generate immediate price movement and remaining value at the current price. Optimally,
they're also in the final stages of a pullback as well (both less risky and more profitable than buying breakouts).
Each TSM Daily Report should contain one forecasted stock or ETF play with accompanying entry and exit points. The entry point
consists of both a pullback range where I prefer to buy and a breakout range. I'll enter my full position at either point
depending on which occurs first, i.e., if, for instance, the TSM pick breaks higher and beyond TSM's breakout point then immediately pullbacks
into TSM's pullback range, the stock is bought at the breakout point. If you set your trades up before the open and can't watch
the market, enter two buy points: half a position at the breakout point and half a position at the midpoint of the pullback range
Each TSM forecast also has a profit range where each stock is sold depending on the intra-day market conditions and two stop-loss
points for each half position. For the last seven quarters, TSM forecasted picks have been profitable more than 70% of the time. While
it's difficult to take a loss, especially considering the quality of these stocks, it's imperative that these small losses are taken when the stops
are hit. THE ABILITY TO TAKE SMALL LOSSES AS PART OF THE STRATEGY IS WHAT SEPARATES THE PROFITABLE TRADER. IT'S THE DIFFERENCE BETWEEN
MARKET PROFESSIONALS AND AMATEURS.
3rd Quarter 2017 (56th Quarter):
Completed 74 Position Trades (67 Winners
& 7 Losers with
90.5% Win Rate for
$96.85
Points Total Gain).
4th Quarter 2017 (57th Quarter):
Completed 58 Position Trades ( 52 Winner
& 6 Losers with
89.7% Win Rate for
$77.21 Points Total Gain).
1st Quarter 2018 (58th Quarter):
Completed 64 Position Trades (48 Winners
& 16 Losers with
74.2% Win Rate for
$33.48
Points Total Gain).
2nd Quarter 2018 (59th Quarter):
Completed 73 Positions Trades (52 Winners & 21 Losers with
71.2% Win Rate for +$25.17 Points Total
Gain).
3rd Quarter 2018 (60th Quarter):
Completed 57 Position Trades (48 Winners
& 9 Losers with
84.2% Win Rate for
$71.85
Points Total Gain).
4th Quarter 2018 (61st Quarter):
Completed 20 Position Trades ( 8 Winner
& 12 Losers with
40.0% Win Rate for
-$17.57 Points Total Gain).
1st Quarter 2019 (62nd Quarter):
Completed 33 Position Trades ( 25 Winner
& 8 Losers with
78.1% Win Rate for
+$23.62 Points Total Gain).
2nd Quarter 2019 (63rd Quarter):
Completed 25 Position Trades ( 18 Winners
& 7 Losers with
77.3% Win Rate for
+$12.47 Points Total Gain).
3rd Quarter 2019 (64th Quarter):
Completed 24 Position Trades ( 21 Winners
& 3 Losers with
87.5% Win Rate for
+$34.11 Points Total Gain).
Links of Interest
History:
Dividends, Splits
Company Profile |
Schaeffer Research
Daily Chart |
Daily Point & Figure Chart |
Other Key Statistics |
Zacks Fundamentals
Note, I am not forecasting individual trades anymore; instead I'm posting my
current trades, shortly after I make them, on the current day's TSM report.
and Find Next Earnings Report
Date
|
Symbol |
Closing Price |
Date Position Initiated |
Buy Price |
Max Price Reached (Min for Short Puts) |
Stop Loss and Profit Con1ditions (1/2 Positions);
Underlying Price for Puts |
Sale Points for Each 1/2 Position |
|
SKX |
close |
08/19/19 |
$31.12 |
$31.17 (+$0.05) |
Take Profit @ $32.12 to $35.00 Closing Stop Loss: $29.94 & $29.44
- not sell market sell off |
08/23 Stop -1.93 8/23 Stop -1.93
09/05 sell +2.80 |
|
EL |
close |
08/02/19 |
Sell 8/16 $185 Put ($4.13), Buy $180 Put ($2.12), Buy $190 Call ($1.12) Risk $4.11 |
8/2/19 +0.89, 8/14 sell $180 Put
+2.38, Shares Put to me basis 185 (181.26) -1.65. 8/19
sell shares +10.00 |
|
OMF |
close |
08/05/19 |
$40.54 |
$40.59 (+$0.05) |
Take Profit @ $41.54 to $45.00
Closing Stop Loss: $35.94 & $35.44 - get $2.25 dividend on 8/26
ex-dividend - not sell dividend take down |
07 09/13 Sell
-$1.54 09/13 -$1.54 and 8/26 $2.25 dividend |
|
RCII |
close |
07/31/19 |
$27.05 |
$27.77 (+$0.72) |
Take Profit @ $28.24 to $30.00 Closing Stop Loss: $25.44 & $24.94
- not sell market sell off |
009/04 Stop -1.66
8/13 +$0.65 |
|
DG |
stopped out |
07/22/19 |
$139.03 |
$139.21 (+$0.18) |
Take Profit @ $140.21 to $145.00 Closing Stop Loss: $134.44 & $133.94 |
07/30 Stop
-5.01 8/1 Stop -6.88 |
|
MCK |
close |
07/19/19 |
$139.10 |
$141.49 (+$2.39) |
Take Profit @ $140.10 to $145.00 Closing Stop Loss: $135.94 & $135.44 |
7/29/19 Sell +$2.25 7/29/19 Sell +$2.25 |
|
CAR |
close |
07/17/19 |
$35.64 |
$36.83 (+$1.06) |
Take Profit @ $36.64 to $40.00
Closing Stop Loss: $33.94 & $33.44 |
7/17/25.Sell.+$1.05 7/31 Sell +$1.15 |
|
HIBB |
close |
07/08/19 |
$19.29 |
$20.56 (+$1.27) |
Take Profit
@ $20.29 to $25.00 Closing Stop Loss: $17.44 & $16.94 |
7/12/19.Sell.+$1.25...7/12/19.Sell.+$1.25... |
|
ACGL |
close |
07/01/19 |
$37.19 |
$38.85 (+$2.00) |
Take Profit @ $38.29 to $45.00 Closing Stop Loss: $35.44 & $34.94 |
7/10/19.Sell.+$1.50...7/10/19.Sell.+$5.00... |
|
BLD |
close |
07/01/19 |
$81.02 |
$86.50 (+$5.48) |
Take Profit
@ $82.02 to $90.00 Closing Stop Loss: $79.44 & $78.94 |
7/12/19.Sell.+$5.00...7/12/19.Sell.+$2.00... |
|
EPD |
close |
06/17/19 |
$28.82 |
$30.82 (+$2.00) |
Take Profit
@ $29.92 to $32.00 Closing Stop Loss: $27.44 & $26.94 |
7/12/19.Sell.+$2.00...7/12/19.Sell.+$2.00... |
|
CTL |
close |
06/04/19 |
$10.24 |
$12.22 (+$1.98) |
Take Profit @ $10.74 to $12.00
Closing Stop Loss: $9.44 & $8.94 |
5/06/19.Sell.+$1.10...7/12/19.+$1.95 |
|
SEAS |
close |
06/04/19 |
$31.39 |
$33.94 (+$2.55) |
Take Profit @ $32.39 to $35.00
Closing Stop Loss: $28.44 & $27.94 |
7/15/19.Sell.+$2.50...7/15/19.+$2.50 |
|
UNH |
$219.80 |
12/04/18 |
$279.82 |
$281.11 (+1.19) |
Quality Stock That I'll hold
the shares and write Calls
against them & collect dividends |
Exp=expire, BB=buy back
Wrote 12/7 $282.5 Calls $1.05 Exp $269.18
Wrote 12/14 $272.5 Calls $2.40 Exp ($265.02)
Wrote 12/21 $265 Calls $2.35 Exp($238.34)
Wrote 12/28 $240 Calls $1.34 BB($1.07)
Wrote 12/31 $255 Calls $1.53 BB ($0.02)
1/04 wrote 1/11 $250 Calls $0.87 BB ($0.20)
1/08 wrote 1/18 $255 Calls $1.39 BB 1/14 $1.22
1/16 wrote 1/25 $270 Calls $0.54 BB 1/24 $0.10
1/24 wrote 2/01 $270 Calls $1.55 Exp($268.72)
2/6 wrote 2/15 $270 Calls $0.34 BB 2/13 $0.02
2/13 wrote 2/22 $270 Calls $1.20 Exp 2/22 ($267.11)
2/25 wrote $270 3/1 Calls $0.80 BB 2/27 $0.02
2/27 wrote $260 3/8 Calls $3.10 BB 3/4 $0.07
3/4 wrote $260 3/15 Calls $0.35 Exp ($251.40
3/19 wrote 3/22 $260 Calls $1.50 BB 3/21 $0.05
3/19 Dividend $0.90
3/21 wrote 3/29 $257.5 Calls $0.80 BB 3/26 $0.04
3/26 wrote 4/05 $250 Calls $2.80 Exp $248.76
4/08 wrote 4/12 $250 Calls $2.40 Exp $223.32
4/16 wrote.4/18.$245.Calls.$0.93.($238.01)
5/03 wrote.5/10.$237.5.Calls.$1.42.BB.$3.25.($240.64)
4/13 wrote.5/17.$247.5.Calls.$0.50.Exp($241.38)
5/20 wrote.5/31.$247.5 Calls.$0.35.Exp($241.80)
6/3 wrote.6/07.$245 Calls.$0.50.BB $0.10($242.19)
6/10 wrote.6/14.$255 Calls.$0.50.Exp($245.37)
6/14 Dividend $1.08
6/17 wrote.6/21.$255 Calls.$0.81.Exp($252.28)
6/24 wrote.6/28.$255 Calls.$2.14 Exp ($244.01)
7/15 wrote.7/19.$275 Calls.$1.24 Exp ($256.65)
7/22 wrote 7/26 $265 Calls $0.44 BB $0.05($252.01)
7/29 wrote 8/02 $260 Calls $1.03 BB $0.01 ($251.50)
8/2 wrote 8/09 $250 Calls $3.90 EXP(248.63)
8/12 wrote 8/16 $250 Calls $1.95 EXP(245.69)
8/19 wrote 8/30 $250 Calls $3.25 Exp(234.00)
9/03 wrote 9/13 $240 Calls $0.94 BB $0.02 ($230.10)
9/12 wrote 9/20 C$237.5 Calls $2.13 Exp(232.89
9/16/19 Dividend $1.08
9/23 wrote 9/27 $232.5 Calls $1.50 Exp(215.26)
9/30 wrote 10/11 $225 Calls $1.27
Total Income: $47.94 per 1/2 Position |

| 


