As an example of the TSM approach, consider the following trade as described in the TSM Daily
Before-the-Bell Report on 5/19/05.
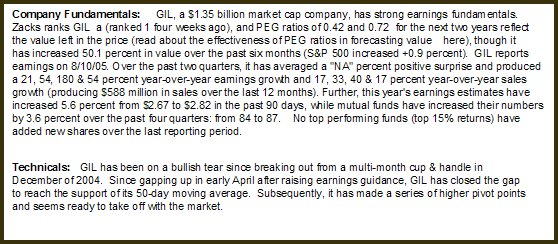
Obviously, GIL is a mid-cap company with quality
fundamentals, an improving Industry Group, good
earnings-revision fuel (Zacks 1 ranking), and much value left at
present prices (two-year PEG ratios less than 1.0). Though to
this point GIL had seen price growth of 50.1% over the past six
months, earnings were still growing, and value remained.
Not shown here is GIL’s daily
chart with explicit trade-management instructions, which is
routinely included with each TSM selection.
Technically, GIL had just experienced a 5-day pullback, the
first after a major period of consolidation followed by a
bullish run in the past month. GIL looked as if it were ready
to resume its longer-term bullish run. The following chart
documents the trade evolution.
The local
minimum (area “A”) offers support (technical stop-loss point)
for a trade reversal after entry on May 19th at the
first arrow. As shown in the “entry” box, the trade was entered
when that day’s price exceeded the prior day’s high (a
demonstration that bulls were in control). A few days later on
the 23rd half the position was sold for a $0.80/share
profit (+3.5%). Profit taking here combined with a resetting of
the stop-loss point ensures that this profitable trade doesn’t
turn negative.
As GIL’s
price continued to run up, a 2-day trailing-stop (sell stop
placed near the low of the preceding two days) strategy was
utilized as price climbed into an area of consolidation marked
“B.” Price thrust upward into late May then profit taking began
(pullback into area “D”). As shown in the “exit” box, the
second ˝ position was sold for a $3.38/share profit (+14.7%).
The position was re-entered in late June (not shown here).
The TSM
approach uses quality stocks as a vehicle to take short-term
profits (~55%), to eliminate quickly those positions that
reverse or don’t continue as expected (~40%), and to let strong
performers run so as to capture greater profits over a longer
term (~5%).
CLICK HERE TO LEARN MORE