TripleScreenMethod.com
Combining Fundamentals with TradingMarkets’ PowerRatings
Richard W. Miller, Ph.D.
As a technical-fundamentalist, I like the security of knowing that the stock I’ll trade over the next few days meets certain fundamental and value criteria. I know then that, if I’m right technically, there will be lots of institutional interest to support my play. I’ve written several times here about TripleScreenMethod’s approach to screening for a combination of quality company fundamentals, earning revision fuel, and remaining value. The approach has been to first identify a number of stocks (from 20 to 100) meeting the above criteria then look to buy from that list using a pullback strategy. TradingMarkets’ PowerRatings offer a powerful technical approach.
Let me give you an example of how well these approaches work together. I wrote the following in Wednesday’s (4/12/06):
“The S&P is oversold to a degree that historically has produced a bounce back the next day. Larry Connors' work shows a bounce back occurred 81% of the time when the following conditions were met: (1) S&P trading above its 200-day moving average (we're there); (2) Intra-day makes a 10-day low (we're there); (3) VIX closes 5% or greater above its 10-day moving average (we're at plus 11.5%). Odds favor a bounce tomorrow so I've looked for several long candidates in which I'll try to take profits quickly.”

With the state of the
market ready to bounce, eight fundamentally sound stocks had PowerRatings of 8 or greater. These were ready to rebound with
the market. The strategy was to buy a full position at the open (say 1,000
shares of each -- $501,840 for the 13 stocks identified over the next two
days), to use a 7.5% stop loss (risk about $38,000), then scale out in 3%
gain increments (1/3 of the position at each increment) (~$15,000 gain at
each increment).
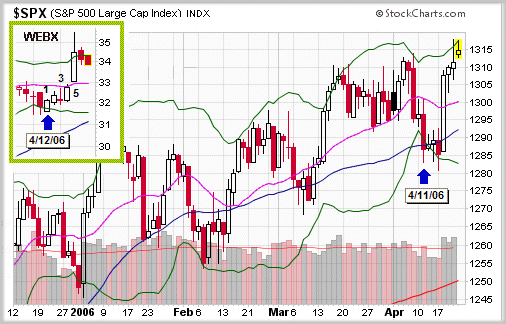
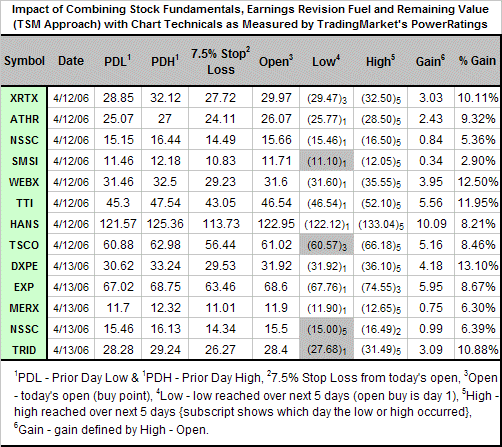
WEBX, inserted in the included chart, shows how a typical trade played out from the first day (4/12) to the fifth trading day (marked on the chart). The low for the trade occurred on day one, the high on day five—both subscripted in the table. All 13 trades were profitable: buying 1,000 shares at the open and exiting at the high over the next five days would have produced a maximum $46,360 gain, 9.24% average return or 408% annualized (over 221 trading days). Results for all trades are summarized in the following table:

Further observations: (1) waiting for today’s price to exceed yesterday’s high (demonstrate strength) would have reduced the gains significantly (because of the respective fundamentals and the state of the market, I didn’t require this usual restriction); (2) one could have used the prior day’s low as a technical stop loss point to scale out of half your position (four days with shaded lows would have met that restriction).
Obviously marrying a good fundamental approach with a solid technical one can reap benefits. I continue to use this type approach daily and will report results from time to time. Note: without the oversold market, I require a demonstration of the pullback’s reversal before entering.