 |
FEEL FREE TO PRINT THIS
WEEKEND REPORT
|
"An Approach
to Successful Stock Trading Combining Company
Fundamentals with Chart Technicals" |
|
Comments or Questions (TSM Service, Methodology, Performance or Your Success Stories)
Go Here
- (rmiller@triplescreenmethod.com)
|
|
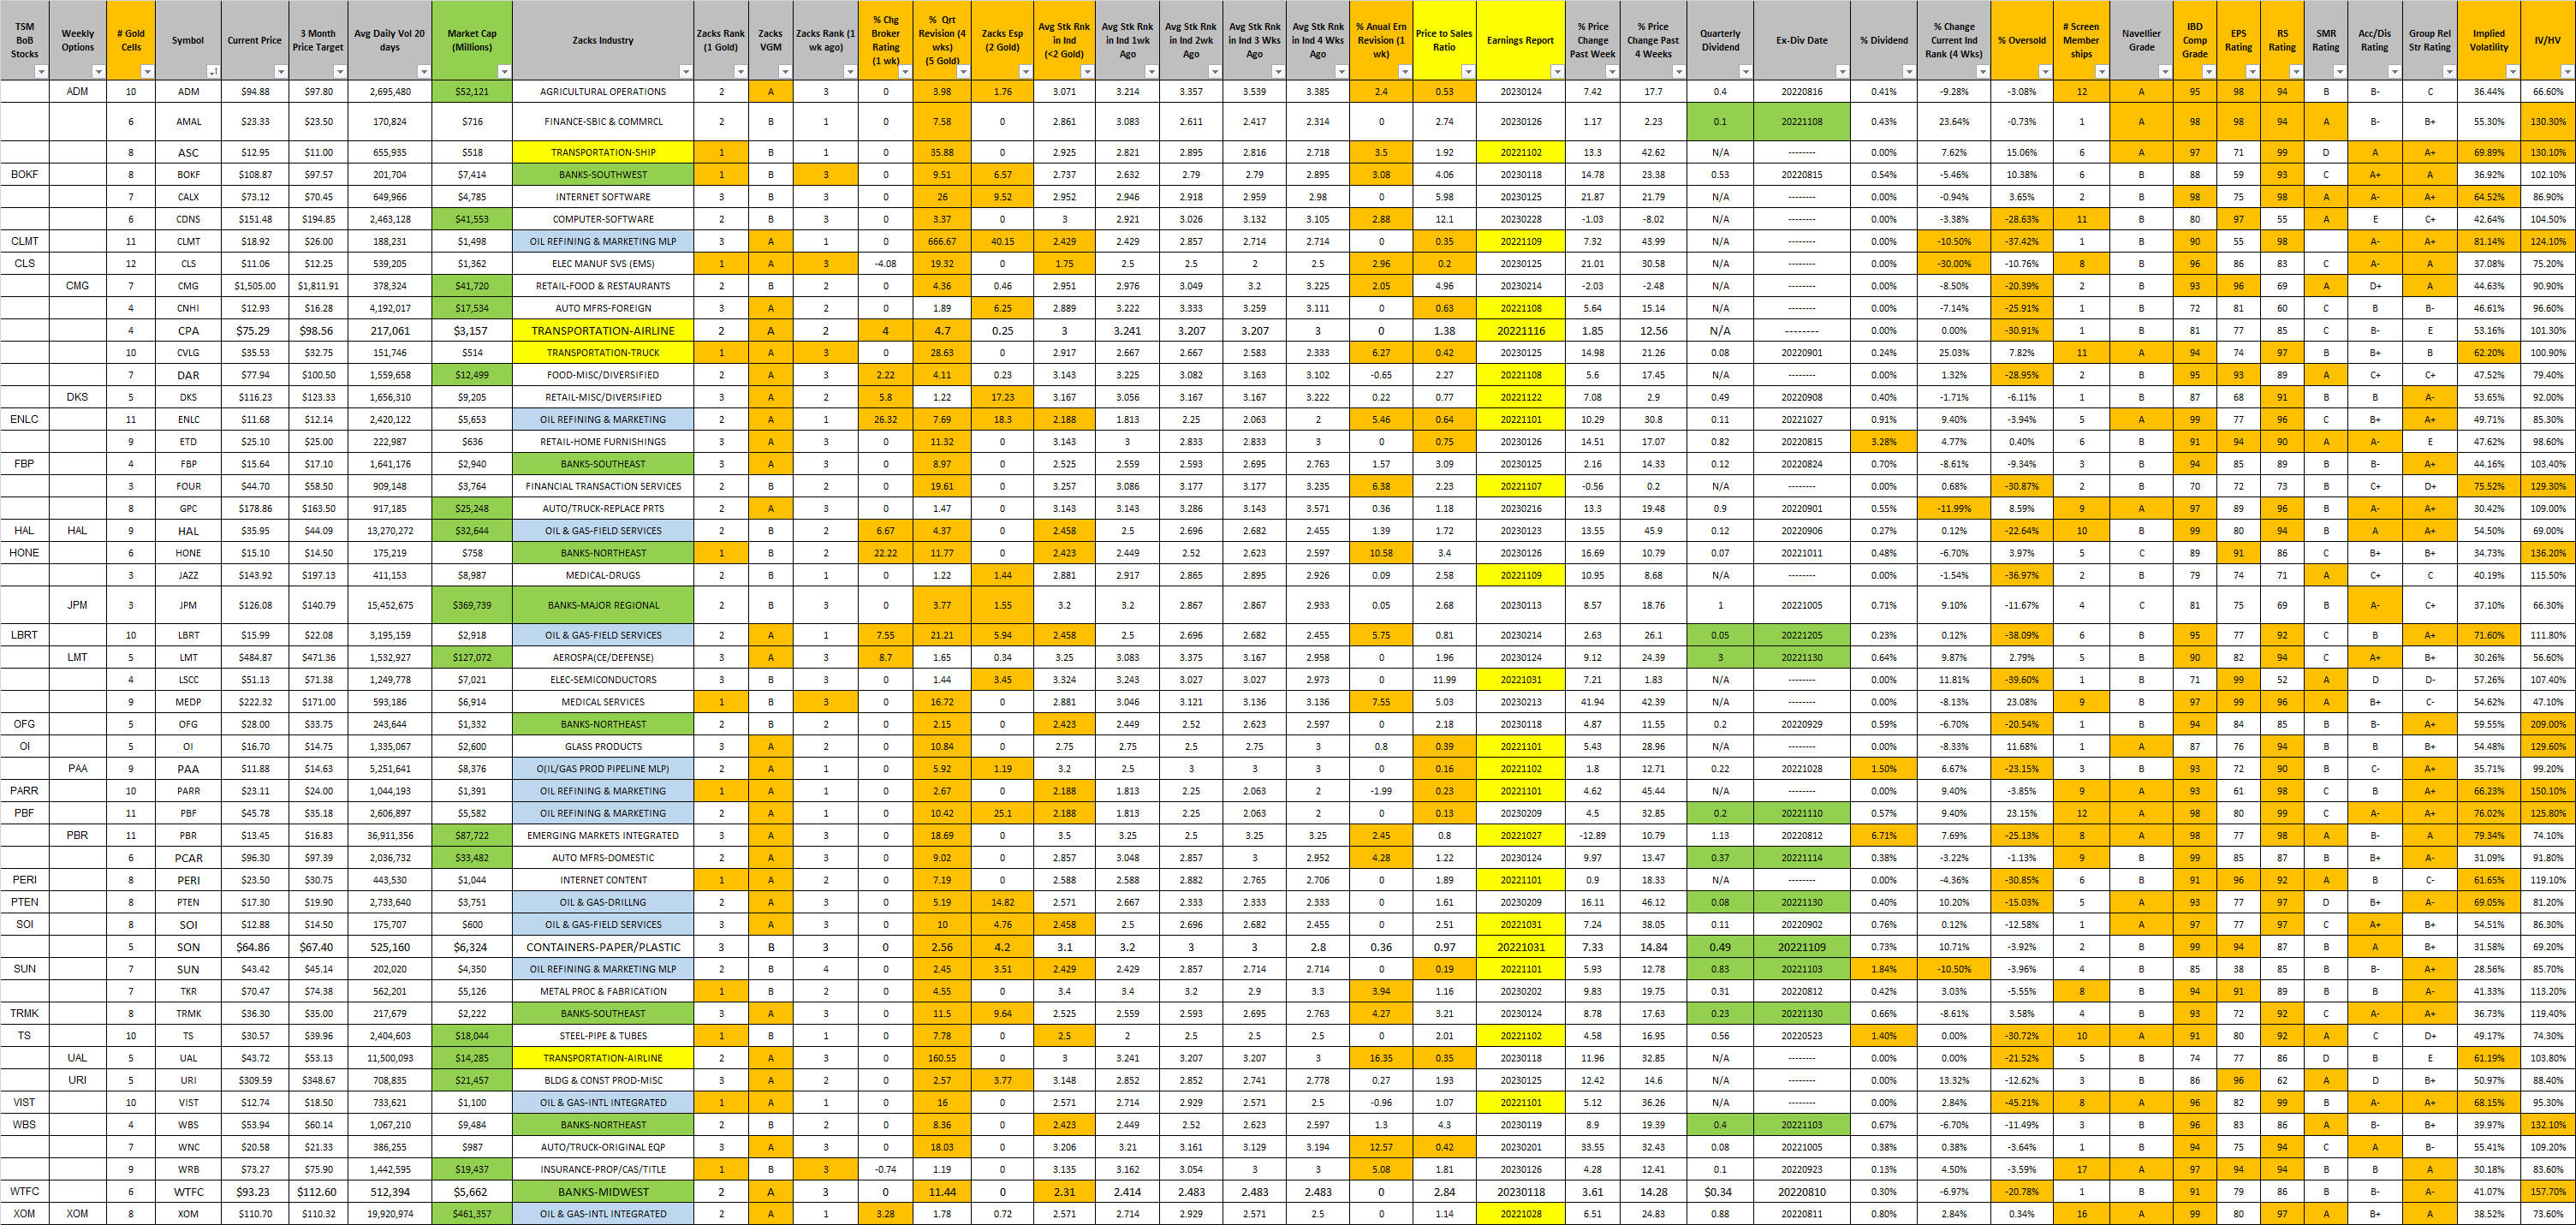
- Weekly TSM Qualified Stocks - |
TripleScreenMethod.com
A list of new TSM picks
(accumulated from four fundamental, a value, and an earnings quality/revision
screen) is published in Mondays TSM Report: 50 to 150 stocks with
strong fundamentals, with projected quality earning’s performance
(Zacks), and with remaining value (two year PEG ratios).
This is the list that I search daily looking for those stocks giving strong
technical signals, i.e., those stocks that are likely to make a bullish run over
the next 1 to 10 days. In 2006, for example, 174 picks (longs and shorts)
were forecast in the daily TSM reports, each with their respective buy/short
points and profit and loss targets: 164 (94.25%) gained at least $0.25,
152 (87.36%) gained at least $0.50, 140 (80.46%) gained at least $0.75, 129
(74.14%) gained at least $1.00, 99 (56.90%) gained at least $1.50, 76 (43.68%)
gained at least $2.00, 52 (29.89%) gained at least $2.50, 32 (18.39%) gained at
least $3.00 and 18 (10.34%) gained at least $3.00.
Triple Screen Qualified Stocks
(fundamentals, earnings
revision fuel and value)
|
Table Definitions:
Red Ticker : indicates that one of the
fundamental screens is a Zacks screen; there are a total of
9 fundamental screens and an independent Zacks screen (indpendent
Zacks ranking is a positive);#
Fun Screens + Zacks Screen : a count of the
number of fundamental screen memberships; if symbol is red,
one of these is the Zacks screen (greater # is better);
Zacks Ranks : Zacks Current and 4 week ago ranking (smaller
is better);
1st Year & 2nd Year PEG : Price-to-Earnings-to-Earnings
Growth ratio for current and next year where growth is
calculated from this year's estimated to last year's actual
(1st year) (below 1.0 is better);% Change in Insider Holdings (24 Wks) :
% Change in insider holdings over the past six months
(larger is better);% Chg Earn Est : % Change in
current year's earning's estimate over past 5 weeks (larger
is better);Qrt Earn Rpt Due : Date for next
quarterly earnings report (year : month : day);Avg Earn
Surprise : Average earnings surprise (%) over the past two
quarters (larger is better);Price/Sales : Price-to-sales
ratio (smaller is better);6 Month Price Growth : %
Price change over the past 6 months (larger is better)
Ratio Price to 52-Wk High : Ratio of today's price with
stocks 52 week high (larger is better);Avg 20-Day Volume
: Average daily volume for the past 20 days.
|
02/03/12 TSM
Picks for the Week (Survivors from 32 Fundamental Screens)
Searchable Excel File
|
Ticker |
# Screens: VectorVest(4), IBD(13), Other(12), Zacks (3) |
Sector - Industry |
TSM Ranks |
Zacks Rank |
Zacks Rank (4 wks ago) |
1st Year PEG |
2nd Year PEG |
Current Price |
Target Price Est |
Market Cap ($mil) |
Price/ Book |
Price/ Sales |
Div Yield (%) |
Avg Daily Vol 20 days |
%Ch Curr Fiscal Yr Earn Est - 4 wks |
Net % Chg Insider Holdings 12 Wks |
Next EPS Report Date |
Return on Investment (% ROI) |
5 Yr % ROI Avg |
% Under Valued |
Sector # |
Current Price / 52-Week High |
# Weeks on TSM List Over Last 114 wks |
Member in This # of TSM Screens |
|
AAN |
0-0-1-3 |
DIVERSIFIED SERVICES - Rental & Leasing Services |
5 |
1 |
3 |
1.15 |
1.39 |
$28.62 |
$30.56 |
$2,161
|
2.4 |
1.09 |
0.21 |
663,805 |
0.55 |
N/A |
20120210 |
12.96 |
12.09 |
6.79 |
13 |
0.98 |
18 |
4 |
|
AAPL |
3-3-8-1 |
COMPUTER HARDWARE - Personal Computers |
6 |
1 |
3 |
0.21 |
0.78 |
$459.68 |
$581.79 |
$427,231 |
4.74 |
3.34 |
0 |
11,517,966 |
21.53 |
N/A |
20120418 |
44.35 |
32.8 |
26.56 |
10 |
1 |
85 |
15 |
|
ABC |
0-1-2-0 |
WHOLESALE - Drugs Wholesale |
3 |
3 |
3 |
1.37 |
0.98 |
$39.23 |
$45.54 |
$10,135 |
3.49 |
0.13 |
1.33 |
2,292,038 |
-0.08 |
N/A |
20120426 |
16.39 |
12.99 |
16.08 |
3 |
0.91 |
37 |
3 |
|
ABT |
1-1-6-0 |
DRUGS - Drug Manufacturers - Major |
3 |
3 |
3 |
1.38 |
1.42 |
$55.00 |
$59.30 |
$85,679 |
3.47 |
2.21 |
3.49 |
7,688,631 |
-0.45 |
-19.66 |
20120418 |
19.27 |
18.66 |
7.82 |
4 |
0.97 |
11 |
8 |
|
ABX |
2-1-4-0 |
METALS & MINING - Gold |
6 |
3 |
2 |
0.59 |
0.42 |
$49.07 |
$64.52 |
$49,082 |
2.01 |
3.64 |
1.22 |
7,133,198 |
-4.57 |
N/A |
20120216 |
13.63 |
10.06 |
31.48 |
6 |
0.88 |
33 |
7 |
|
ACAT |
0-0-1-2 |
AUTOMOTIVE - Recreational Vehicles |
5 |
1 |
1 |
0.13 |
0.38 |
$34.23 |
$38.60 |
$626 |
4.4 |
1.12 |
0 |
233,220 |
37.57 |
-98.3 |
20120510 |
14.93 |
3.23 |
12.77 |
2 |
1 |
2 |
3 |
|
ACN |
3-1-1-0 |
COMPUTER SOFTWARE & SERVICES - Information Technology Services |
4 |
3 |
3 |
1.25 |
1.25 |
$58.31 |
$61.53 |
$37,739 |
8.86 |
1.33 |
2.32 |
4,268,080 |
0.01 |
64.81 |
20120315 |
56.79 |
53.37 |
5.52 |
16 |
0.92 |
35 |
5 |
|
AGN |
3-0-2-0 |
DRUGS - Drug Manufacturers - Other |
3 |
3 |
3 |
1.39 |
1.18 |
$86.08 |
$92.75 |
$26,257 |
4.92 |
4.85 |
0.23 |
1,883,536 |
-0.75 |
N/A |
20120509 |
17.14 |
14.51 |
7.75 |
4 |
0.96 |
5 |
5 |
|
AJG |
0-0-1-1 |
INSURANCE - Insurance Brokers |
2 |
1 |
3 |
0.5 |
1 |
$34.78 |
$36.55 |
$3,969 |
3.19 |
1.86 |
3.8 |
531,702 |
4.19 |
N/A |
20120424 |
8.22 |
12 |
5.08 |
13 |
1 |
1 |
2 |
|
AKRX |
2-1-1-2 |
DRUGS - Drugs - Generic |
5 |
1 |
3 |
0.85 |
0.39 |
$12.09 |
$13.25 |
$1,147 |
7.6 |
9.69 |
0 |
1,058,217 |
-5.95 |
-76.67 |
20120228 |
13.86 |
-15.23 |
9.6 |
4 |
1 |
5 |
6 |
|
AL |
1-0-0-1 |
DIVERSIFIED SERVICES - Rental & Leasing Services |
3 |
2 |
2 |
0.13 |
0.32 |
$25.38 |
$29.94 |
$2,510 |
1.17 |
N/A |
0 |
370,815 |
0.73 |
N/A |
20120216 |
N/A |
N/A |
17.98 |
15 |
0.86 |
1 |
2 |
|
ALXN |
1-5-3-0 |
DRUGS - Biotechnology |
3 |
2 |
3 |
1.4 |
1.08 |
$78.88 |
$76.56 |
$14,603 |
13.79 |
20.52 |
0 |
1,098,296 |
2.22 |
-1.19 |
20120209 |
20.84 |
-0.79 |
-2.93 |
4 |
1 |
8 |
9 |
|
AMGN |
2-1-3-0 |
DRUGS - Biotechnology |
2 |
2 |
3 |
0.85 |
1.03 |
$69.28 |
$69.82 |
$60,727 |
2.72 |
3.9 |
1.62 |
6,519,583 |
4.87 |
-21.09 |
20120418 |
15.5 |
17.91 |
0.79 |
4 |
0.99 |
2 |
6 |
|
ASNA |
0-0-1-1 |
SPECIALTY RETAIL - Apparel Stores |
3 |
2 |
3 |
1.03 |
1.01 |
$36.06 |
$37.90 |
$2,763 |
2.36 |
0.93 |
0 |
616,944 |
2.74 |
-44.73 |
20120229 |
14.2 |
13.48 |
5.1 |
3 |
1 |
26 |
2 |
|
ATU |
0-0-1-1 |
MANUFACTURING - Diversified Machinery |
3 |
2 |
2 |
0.68 |
1.28 |
$27.21 |
$27.20 |
$1,854 |
2.05 |
1.22 |
0.15 |
655,624 |
0 |
-2.34 |
20120308 |
9.73 |
8.84 |
-0.04 |
7 |
0.91 |
21 |
2 |
|
ATVI |
2-0-2-0 |
COMPUTER SOFTWARE & SERVICES - Multimedia & Graphics Software |
3 |
2 |
2 |
0.97 |
0.58 |
$12.28 |
$15.57 |
$14,051 |
1.33 |
2.94 |
1.34 |
8,492,862 |
0.55 |
-9.96 |
20120209 |
9.44 |
9.13 |
26.8 |
2 |
0.88 |
3 |
4 |
|
AUY |
2-4-1-0 |
METALS & MINING - Gold |
4 |
3 |
3 |
0.64 |
0.31 |
$17.15 |
$20.03 |
$12,788 |
1.74 |
5.98 |
1.17 |
6,854,671 |
-5.03 |
N/A |
20120222 |
9.01 |
5.99 |
16.81 |
6 |
0.97 |
6 |
7 |
|
AYI |
0-0-1-1 |
ELECTRONICS - Diversified Electronics |
3 |
2 |
2 |
0.65 |
0.86 |
$60.30 |
$55.73 |
$2,539 |
3.31 |
1.38 |
0.86 |
410,275 |
7.63 |
-29.72 |
20120328 |
10.11 |
13.5 |
-7.58 |
8 |
0.99 |
3 |
2 |
|
AZO |
2-5-3-1 |
RETAIL - Auto Parts Stores |
3 |
2 |
2 |
0.77 |
0.85 |
$353.18 |
$360.39 |
$13,901 |
|
1.69 |
0 |
356,469 |
0.12 |
-32.14 |
20120228 |
42.05 |
30.49 |
2.04 |
3 |
1 |
39 |
11 |
|
BBBY |
3-1-1-0 |
RETAIL - Home Furnishing Stores |
4 |
2 |
2 |
0.45 |
1.04 |
$63.15 |
$68.65 |
$15,235 |
3.95 |
1.64 |
0 |
2,354,546 |
0 |
N/A |
20120404 |
23.51 |
19.96 |
8.71 |
3 |
1 |
38 |
5 |
|
BC |
0-0-1-1 |
CONSUMER DURABLES - Recreational Goods |
4 |
2 |
3 |
0.17 |
0.38 |
$23.39 |
$28.57 |
$2,084 |
67.44 |
0.56 |
0.21 |
1,362,353 |
3.26 |
N/A |
20120426 |
12.06 |
-6.69 |
22.15 |
2 |
0.87 |
1 |
2 |
|
BEAV |
0-2-1-1 |
AEROSPACE/DEFENSE - Aerospace/Defense Products & Services |
5 |
1 |
3 |
0.65 |
0.69 |
$45.98 |
$50.31 |
$4,742 |
2.53 |
1.9 |
0 |
802,002 |
3.99 |
N/A |
20120423 |
8.29 |
8.22 |
9.41 |
11 |
1 |
5 |
4 |
|
BIDU |
2-0-2-0 |
INTERNET - Internet Information Providers |
6 |
2 |
3 |
0.55 |
0.5 |
$134.53 |
$188.23 |
$36,384 |
16.6 |
19.18 |
0 |
6,027,557 |
0.66 |
N/A |
20120216 |
50.51 |
40.93 |
39.92 |
10 |
0.82 |
65 |
4 |
|
BLK |
3-0-1-0 |
FINANCIAL SERVICES - Asset Management |
2 |
3 |
3 |
1.41 |
0.96 |
$188.64 |
$208.08 |
$25,476 |
1.02 |
2.81 |
2.92 |
774,393 |
0.16 |
-1.21 |
20120419 |
4.54 |
5.8 |
10.31 |
13 |
0.91 |
43 |
4 |
|
BRY |
1-0-1-1 |
ENERGY - Independent Oil & Gas |
3 |
2 |
2 |
0.22 |
0.31 |
$45.68 |
$58.00 |
$2,451 |
1.97 |
3.07 |
0.7 |
741,947 |
3.24 |
-61.61 |
20120301 |
5.45 |
8.17 |
26.97 |
12 |
0.76 |
3 |
3 |
|
CAT |
4-0-2-2 |
MANUFACTURING - Farm & Construction Machinery |
6 |
2 |
3 |
0.31 |
0.53 |
$113.94 |
$131.13 |
$73,676 |
5.7 |
1.23 |
1.62 |
8,032,987 |
4.64 |
N/A |
20120427 |
13.62 |
10.6 |
15.09 |
7 |
0.99 |
53 |
8 |
|
CATM |
0-5-1-2 |
DIVERSIFIED SERVICES - Business/Management Services |
5 |
1 |
2 |
1 |
0.73 |
$25.36 |
$30.67 |
$1,112 |
9.83 |
1.78 |
0 |
487,168 |
-3.36 |
-13.39 |
20120426 |
13.68 |
8.68 |
20.93 |
16 |
0.89 |
44 |
8 |
|
CBS |
1-0-4-1 |
MEDIA - Broadcasting - TV |
5 |
1 |
3 |
0.63 |
0.81 |
$29.48 |
$32.41 |
$19,292 |
2 |
1.34 |
1.36 |
5,878,666 |
0.72 |
N/A |
20120215 |
7.93 |
4.54 |
9.95 |
2 |
1 |
14 |
6 |
|
CELG |
3-7-5-1 |
DRUGS - Biotechnology |
4 |
2 |
2 |
0.51 |
0.81 |
$73.21 |
$82.23 |
$32,500 |
5.9 |
6.71 |
0 |
3,586,914 |
10.8 |
4.51 |
20120426 |
22.61 |
19.01 |
12.32 |
4 |
0.99 |
40 |
16 |
|
CERN |
1-1-2-1 |
COMPUTER SOFTWARE & SERVICES - Healthcare Information Service |
4 |
1 |
3 |
1.24 |
1.02 |
$63.09 |
$70.23 |
$10,688 |
4.83 |
5.12 |
0 |
1,090,725 |
0.22 |
-0.51 |
20120207 |
13.32 |
11.98 |
11.32 |
4 |
0.87 |
7 |
5 |
|
CFX |
2-5-1-0 |
MANUFACTURING - Diversified Machinery |
5 |
2 |
1 |
0.74 |
0.6 |
$33.26 |
$34.50 |
$1,453 |
5.91 |
2.13 |
0 |
1,466,430 |
1.85 |
23.78 |
20120207 |
18.6 |
15.59 |
3.73 |
7 |
1 |
11 |
8 |
|
CHKM |
2-2-1-0 |
ENERGY - Oil & Gas Refining & Marketing |
1 |
2 |
3 |
1.08 |
0.83 |
$28.27 |
$33.06 |
$1,953 |
0.9 |
3.49 |
5.52 |
611,198 |
-1.18 |
N/A |
20120228 |
8.69 |
N/A |
16.95 |
12 |
0.91 |
1 |
5 |
|
CLR |
1-3-2-0 |
ENERGY - Independent Oil & Gas |
4 |
2 |
3 |
0.98 |
0.53 |
$79.28 |
$80.65 |
$14,309 |
5.92 |
N/A |
0 |
1,156,263 |
5.45 |
-8.46 |
20120222 |
14.95 |
20.04 |
1.73 |
12 |
0.96 |
11 |
6 |
|
CMCSA |
1-0-2-0 |
MEDIA - CATV Systems |
4 |
3 |
3 |
0.61 |
0.64 |
$27.15 |
$31.17 |
$73,979 |
1.57 |
1.46 |
1.66 |
14,003,437 |
0.54 |
N/A |
20120215 |
4.31 |
4.09 |
14.8 |
2 |
1 |
26 |
3 |
|
CMCSK |
1-0-3-0 |
MEDIA - CATV Systems |
5 |
2 |
3 |
0.49 |
N/A |
$25.96 |
$33.00 |
$71,367 |
1.52 |
1.41 |
1.73 |
3,501,387 |
1.41 |
N/A |
20120215 |
4.31 |
4.09 |
27.12 |
2 |
1 |
25 |
4 |
|
CMI |
3-0-2-0 |
MANUFACTURING - Diversified Machinery |
5 |
2 |
3 |
0.84 |
0.73 |
$120.09 |
$127.60 |
$23,160 |
3.97 |
1.28 |
1.33 |
2,922,594 |
1.7 |
-11.77 |
20120424 |
27.82 |
18.4 |
6.25 |
5 |
1 |
62 |
5 |
|
CNC |
2-3-2-1 |
HEALTH SERVICES - Health Care Plans |
3 |
2 |
1 |
0.76 |
0.83 |
$46.28 |
$44.92 |
$2,331 |
2.58 |
0.47 |
0 |
502,138 |
0 |
-11.56 |
20120207 |
9.46 |
9.94 |
-2.93 |
4 |
0.99 |
10 |
8 |
|
CNI |
2-0-2-0 |
TRANSPORTATION - Railroads |
3 |
3 |
3 |
1.34 |
1.09 |
$78.41 |
$81.04 |
$34,803 |
3.22 |
3.85 |
1.66 |
1,085,953 |
-0.37 |
N/A |
20120424 |
12.6 |
11 |
3.35 |
15 |
0.97 |
47 |
4 |
|
COH |
3-0-1-1 |
CONSUMER NON-DURABLES - Textile - Apparel Footwear & Accessories |
3 |
2 |
2 |
1.01 |
1.08 |
$72.59 |
$76.56 |
$21,184 |
11.34 |
4.73 |
1.24 |
3,465,051 |
1.21 |
N/A |
20120424 |
53.32 |
44.75 |
5.46 |
2 |
1 |
55 |
5 |
|
CP |
1-0-1-0 |
TRANSPORTATION - Railroads |
1 |
3 |
3 |
0.49 |
0.76 |
$73.96 |
$75.13 |
$12,561 |
2.67 |
2.5 |
1.62 |
887,093 |
1.14 |
N/A |
20120419 |
5.69 |
6.41 |
1.58 |
15 |
1 |
2 |
2 |
|
CPRT |
0-2-3-0 |
SPECIALTY RETAIL - Auto Dealerships |
2 |
2 |
2 |
0.83 |
1.46 |
$47.42 |
$48.00 |
$3,087 |
5.64 |
3.49 |
0 |
170,892 |
0 |
N/A |
20120301 |
17.61 |
16.27 |
1.22 |
16 |
0.97 |
3 |
5 |
|
CPWM |
1-0-2-3 |
RETAIL - Department Stores |
5 |
1 |
3 |
0.28 |
1.05 |
$14.84 |
$14.00 |
$332 |
5.43 |
0.35 |
0 |
289,117 |
6.36 |
N/A |
20120308 |
5.17 |
-11.8 |
-5.66 |
3 |
1 |
5 |
6 |
|
CSX |
2-0-2-0 |
TRANSPORTATION - Railroads |
4 |
3 |
3 |
0.94 |
0.74 |
$23.17 |
$27.87 |
$24,327 |
2.87 |
2.07 |
2.07 |
11,085,214 |
-1.59 |
N/A |
20120417 |
10.85 |
8.61 |
20.29 |
15 |
0.86 |
43 |
4 |
|
CTAS |
0-0-2-1 |
SPECIALTY RETAIL - Apparel Stores |
3 |
1 |
1 |
0.5 |
1.37 |
$37.90 |
$35.50 |
$4,917 |
2.34 |
1.23 |
1.43 |
1,042,899 |
0.08 |
-6.49 |
20120320 |
8.27 |
9.12 |
-6.33 |
7 |
1 |
2 |
3 |
|
CTSH |
2-0-2-0 |
COMPUTER SOFTWARE & SERVICES - Business Software & Services |
3 |
2 |
3 |
1.05 |
0.93 |
$73.35 |
$84.00 |
$22,160 |
5.65 |
3.84 |
0 |
2,049,307 |
0.39 |
N/A |
20120208 |
22.3 |
23.8 |
14.52 |
10 |
0.89 |
7 |
4 |
|
CVS |
2-0-4-1 |
RETAIL - Drug Stores |
2 |
2 |
2 |
0.84 |
0.96 |
$43.51 |
$46.25 |
$56,634 |
1.56 |
0.55 |
1.49 |
6,972,848 |
0.22 |
N/A |
20120208 |
7.82 |
8.04 |
6.3 |
3 |
1 |
2 |
7 |
|
CXO |
0-3-1-0 |
ENERGY - Oil & Gas Drilling & Exploration |
4 |
3 |
3 |
0.71 |
0.36 |
$108.49 |
$117.03 |
$11,249 |
3.68 |
7.1 |
0 |
854,417 |
-1.39 |
N/A |
20120222 |
8.89 |
7.38 |
7.87 |
12 |
0.99 |
9 |
4 |
|
CZZ |
0-0-1-3 |
FOOD & BEVERAGE - Confectioners |
6 |
1 |
3 |
0.17 |
0.06 |
$13.71 |
$15.83 |
$2,390 |
0.42 |
0.18 |
2.05 |
965,469 |
7.78 |
N/A |
20120208 |
23.42 |
6.1 |
15.49 |
6 |
0.98 |
1 |
4 |
|
DD |
2-0-3-0 |
CHEMICALS - Chemicals - Major Diversified |
4 |
3 |
3 |
1.4 |
0.86 |
$52.01 |
$57.38 |
$48,053 |
5.45 |
1.24 |
3.15 |
6,095,363 |
0.72 |
36.12 |
20120419 |
16.24 |
15.43 |
10.32 |
6 |
0.92 |
43 |
5 |
|
DG |
0-5-4-0 |
RETAIL - Discount |
4 |
3 |
2 |
0.92 |
0.84 |
$41.94 |
$45.07 |
$14,148 |
3.15 |
1 |
0 |
1,568,342 |
0.12 |
-13.47 |
20120320 |
10.15 |
8.1 |
7.47 |
3 |
0.98 |
17 |
9 |
|
DHR |
3-0-1-0 |
CONGLOMERATES - Conglomerates |
2 |
3 |
3 |
0.97 |
1.23 |
$52.87 |
$58.19 |
$36,287 |
2.14 |
2.23 |
0.19 |
2,993,492 |
0.27 |
N/A |
20120419 |
9.36 |
10.5 |
10.06 |
9 |
0.95 |
42 |
4 |
|
DIS |
2-0-1-0 |
MEDIA - Entertainment - Diversified |
1 |
3 |
3 |
0.84 |
0.85 |
$40.00 |
$42.79 |
$71,861 |
1.88 |
1.76 |
1.5 |
9,613,598 |
0.07 |
1.93 |
20120207 |
9.72 |
8.71 |
6.97 |
2 |
0.91 |
47 |
3 |
|
DISCA |
0-1-1-1 |
MEDIA - CATV Systems |
1 |
3 |
3 |
0.91 |
0.82 |
$44.66 |
$46.73 |
$11,802 |
1.98 |
2.86 |
0 |
1,192,711 |
-0.13 |
N/A |
20120216 |
8.94 |
4.75 |
4.64 |
2 |
0.99 |
8 |
3 |
|
DLTR |
1-4-4-0 |
RETAIL - Discount |
3 |
2 |
2 |
0.94 |
1 |
$85.65 |
$86.90 |
$10,194 |
7.22 |
1.59 |
0 |
1,107,715 |
0.18 |
-13.17 |
20120222 |
26.53 |
19.46 |
1.46 |
3 |
1 |
55 |
9 |
|
DOV |
0-0-3-0 |
MANUFACTURING - Diversified Machinery |
3 |
3 |
2 |
1.34 |
1.06 |
$65.63 |
$68.67 |
$12,166 |
2.47 |
1.46 |
1.92 |
1,403,671 |
0.11 |
-0.25 |
20120419 |
11.76 |
10.72 |
4.63 |
7 |
0.94 |
23 |
3 |
|
DTV |
2-0-3-0 |
MEDIA - CATV Systems |
6 |
3 |
2 |
0.36 |
0.35 |
$45.69 |
$54.84 |
$32,238 |
|
1.22 |
0 |
6,215,039 |
-0.51 |
-39.35 |
20120216 |
21.21 |
15.76 |
20.03 |
10 |
0.86 |
47 |
5 |
|
DVA |
0-0-3-1 |
HEALTH SERVICES - Specialized Health Services |
3 |
2 |
2 |
0.58 |
1.03 |
$83.92 |
$88.30 |
$7,847 |
3.76 |
1.16 |
0 |
540,112 |
0.16 |
N/A |
20120216 |
6.81 |
6.71 |
5.22 |
4 |
0.94 |
2 |
4 |
|
ECL |
2-1-2-0 |
CONSUMER NON-DURABLES - Cleaning Products |
2 |
3 |
2 |
1.07 |
0.77 |
$61.53 |
$64.42 |
$18,485 |
5.78 |
2.83 |
1.3 |
1,689,790 |
1.21 |
5.21 |
20120228 |
19.37 |
17.92 |
4.69 |
6 |
1 |
3 |
5 |
|
ELN |
1-0-1-1 |
DRUGS - Drug Delivery |
3 |
2 |
2 |
0.22 |
0.3 |
$13.98 |
$17.50 |
$8,181 |
8.68 |
6.37 |
0 |
3,451,348 |
-17.65 |
N/A |
20120208 |
-2.88 |
-15.55 |
25.18 |
4 |
0.98 |
1 |
3 |
|
EMC |
2-0-2-0 |
COMPUTER HARDWARE - Data Storage Devices |
3 |
3 |
2 |
1.15 |
0.99 |
$26.39 |
$30.54 |
$53,834 |
2.7 |
2.69 |
0 |
23,096,862 |
0.07 |
-2.26 |
20120418 |
14.55 |
10.29 |
15.72 |
10 |
0.93 |
53 |
4 |
|
EOG |
3-0-0-1 |
ENERGY - Independent Oil & Gas |
3 |
2 |
3 |
0.88 |
0.41 |
$109.09 |
$115.64 |
$29,329 |
2.35 |
3.21 |
0.59 |
2,157,896 |
1.72 |
N/A |
20120217 |
4.75 |
10.8 |
6 |
12 |
0.91 |
7 |
4 |
|
EQIX |
0-3-0-1 |
TELECOMMUNICATIONS - Telecom Services - Domestic |
2 |
1 |
2 |
1.24 |
0.99 |
$124.19 |
$120.60 |
$5,888 |
2.89 |
3.87 |
0 |
1,054,167 |
0.04 |
-26.27 |
20120215 |
2.14 |
1.25 |
-2.89 |
10 |
1 |
2 |
4 |
|
ESRX |
3-0-2-0 |
HEALTH SERVICES - Health Care Plans |
6 |
3 |
4 |
0.69 |
0.67 |
$52.08 |
$59.00 |
$25,284 |
11.75 |
0.56 |
0 |
6,445,114 |
0.15 |
N/A |
20120216 |
26.12 |
24.35 |
13.29 |
4 |
0.86 |
51 |
5 |
|
ESV |
1-0-1-0 |
ENERGY - Oil & Gas Drilling & Exploration |
2 |
3 |
3 |
0.1 |
0.68 |
$55.65 |
$65.65 |
$12,834 |
1.2 |
5.71 |
2.52 |
2,700,574 |
-2.22 |
-8.13 |
20120223 |
4.66 |
17.72 |
17.97 |
12 |
0.93 |
1 |
2 |
|
|