|
|
 |
FEEL FREE TO PRINT THIS WEEKDAY REPORT
|
"An
Approach to Successful Stock Trading Combining Company
Fundamentals with Chart Technicals" |
|
Comments or Questions (TSM Service, Methodology, Performance
or Your Success Stories)
Go Here
-
(rmiller@triplescreenmethod.com)
|
Writing Naked Puts Strategy
Special Reports:
"A Strategy for Greater Returns. Part I: The Naked Put"
(Revisit this report as I follow the Portfolio's progression;
Note, I'll suggest candidates for this this portfolio weekly
- Fresh material 02/09/09)
"A Strategy for Greater Returns. Part II: The Deep In-the-Money Covered Call"
(01/25/09)
The deep in-the-money Naked Put strategy we'll concentrate on here is designed
to generate income in an economic environment where a decent return is hard to come by.
The in-the- money Covered Call strategy is then utilized to rid ourselves of any
stock put to us. There are three characteristics that we want to achieve from these naked Put
plays: (1) at least a 18% annual return, (2) at least
10% downside protection, and (3) if we're writing a naked Put, a chance to buy the underlying at least at a
10% discount.
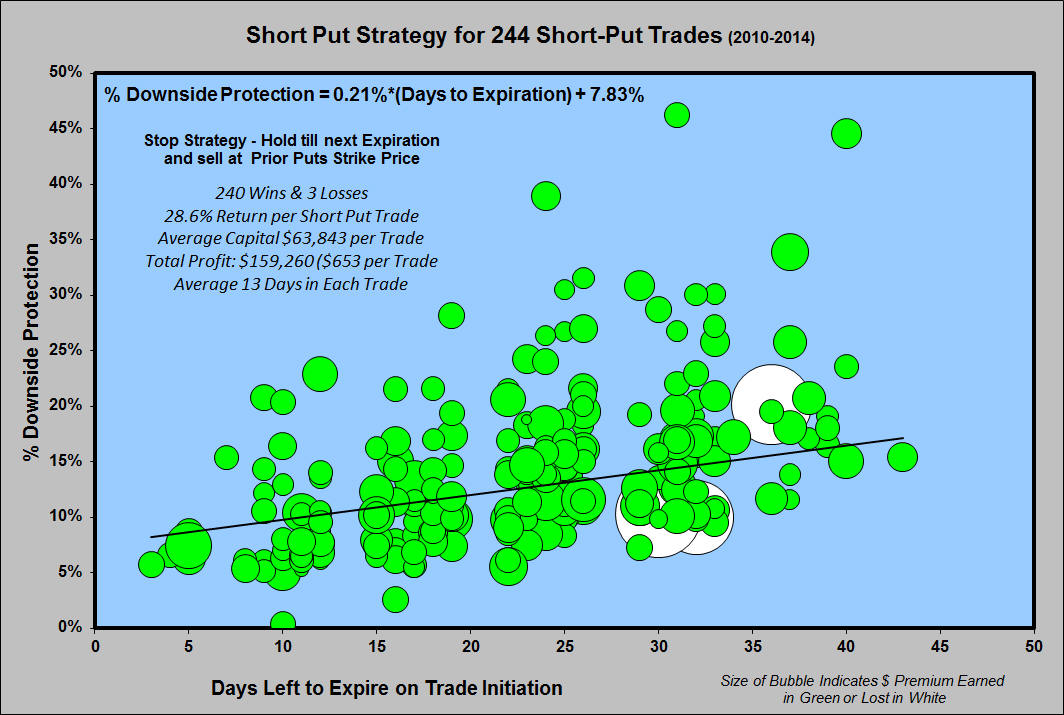
The following plot shows the relationship between days in the trade and
initial % downside protection for the 244 short put trades. There were 214
winners (in green) and 29 losers (in white), and the size of the balloon indicates
the size of the premium captured.
Over these last 4 years, this approach has generated a 88.1% win rate with a
19% annualized rate of return for each trade.
Notice how nearly all these losses could be avoided if these trades were limited
to 27 days or less to expiration and its downside protection above the
regression line:
% Downside Protection = 7.83% + 0.21% x (# of Days to Expiration)

Notice too, how the profit situation improves when the stop-loss strategy is changed
as follows: when a losing position puts shares to me, an immediate sell trade is
entered at the losing Put's strike price and held there till the next month's expiration where either
the shares had been sold earlier for a profit or at the second expiration closed
at a loss. This simple strategy reduced the 29 losses to 3 and increased
the gains to $159,260.
The real key here is to deal only in quality stocks, i.e., those that have
institutional support, i.e., a safety net for our trades.
Find Explanation for "Repair Strategy" here. Find an Excel program that will allow you to analyze various option positions here.
|
HISTORICAL SHORT PUT TRADES
(08/04/10 - 02/23/14) |
| |
|
|
Wins |
Losses |
$ |
Avg(# Days) |
Avg Profit ($) |
Avg Invest ($) |
% return |
Annualized % Return |
|
|
|
|
|
|
|
|
|
214 |
29 |
$105,506 |
13.04 |
$432 |
$63,843 |
0.68% |
18.96% |
|
|
|
|
|
| |
Portfolio Growth |
Symbol |
Profit/Loss |
Strike |
Premium |
Invested |
Written |
Closed |
Days |
Downside |
Price |
Expiration |
Initial Loss |
Repair Strategy |
Days to Expiration |
|
1 |
$400 |
CMI |
400 |
72.5 |
$600 |
$71,900 |
08/04/10 |
08/10/10 |
7 |
0.105388 |
80.37 |
08/20/10 |
|
|
17 |
|
2 |
$480 |
WYNN |
80 |
85 |
$1,040 |
$83,960 |
08/05/10 |
08/11/10 |
7 |
0.070931 |
90.37 |
08/20/10 |
|
|
16 |
|
3 |
$1,010 |
NFLX |
530 |
105 |
$670 |
$104,330 |
08/09/10 |
08/11/10 |
3 |
0.103925 |
116.43 |
08/20/10 |
|
|
12 |
|
4 |
$1,310 |
LVS |
300 |
115 |
$500 |
$114,500 |
08/16/10 |
08/23/10 |
8 |
-2.98538 |
28.73 |
09/17/10 |
|
|
33 |
|
5 |
$2,740 |
NFLX |
1430 |
115 |
$3,500 |
$111,500 |
08/18/10 |
08/23/10 |
6 |
0.127338 |
127.77 |
09/17/10 |
|
|
31 |
|
6 |
$3,290 |
MED |
550 |
25 |
$750 |
$24,250 |
08/19/10 |
09/02/10 |
15 |
0.13578 |
28.06 |
09/17/10 |
|
|
30 |
|
7 |
$3,990 |
WYNN |
700 |
75 |
$830 |
$74,170 |
08/30/10 |
09/03/10 |
5 |
0.104768 |
82.85 |
09/17/10 |
|
|
19 |
|
8 |
$4,640 |
CMI |
650 |
75 |
$950 |
$74,050 |
09/02/10 |
09/03/10 |
2 |
0.078407 |
80.35 |
09/17/10 |
|
|
16 |
|
9 |
$5,200 |
WYNN |
560 |
85 |
$680 |
$84,320 |
09/09/10 |
09/14/10 |
6 |
0.060187 |
89.72 |
09/17/10 |
|
|
9 |
|
10 |
$6,260 |
RIMM |
1060 |
42.5 |
$1,060 |
$41,440 |
09/13/10 |
09/17/10 |
5 |
0.063079 |
44.23 |
09/17/10 |
|
|
5 |
|
11 |
$6,560 |
VECO |
300 |
30 |
$700 |
$29,300 |
09/14/10 |
09/23/10 |
10 |
0.191055 |
36.22 |
10/15/10 |
|
|
32 |
|
12 |
$7,370 |
FFIV |
810 |
90 |
$1,460 |
$88,540 |
09/17/10 |
09/23/10 |
7 |
0.118917 |
100.49 |
10/15/10 |
|
|
29 |
|
13 |
$8,120 |
DECK |
750 |
45 |
$1,050 |
$43,950 |
09/20/10 |
09/29/10 |
10 |
0.110324 |
49.4 |
10/15/10 |
|
|
26 |
|
14 |
$8,740 |
HOT |
620 |
50 |
$800 |
$49,200 |
09/29/10 |
10/05/10 |
7 |
0.056748 |
52.16 |
10/15/10 |
|
|
17 |
|
15 |
$9,290 |
CMI |
550 |
85 |
$850 |
$84,150 |
09/29/10 |
10/06/10 |
8 |
0.083733 |
91.84 |
10/15/10 |
|
|
17 |
|
16 |
$10,050 |
BIDU |
760 |
90 |
$1,060 |
$88,940 |
10/04/10 |
10/06/10 |
3 |
0.07614 |
96.27 |
10/15/10 |
|
|
12 |
|
17 |
$11,050 |
FCX |
1000 |
85 |
$1,400 |
$83,600 |
10/20/10 |
10/21/10 |
2 |
0.124699 |
95.51 |
11/19/10 |
|
|
31 |
|
18 |
$12,320 |
BIDU |
1270 |
85 |
$1,500 |
$83,500 |
10/20/10 |
10/22/10 |
3 |
0.170145 |
100.62 |
11/19/10 |
|
|
31 |
|
19 |
$13,520 |
CMI |
1200 |
85 |
$1,350 |
$83,650 |
10/22/10 |
11/05/10 |
15 |
0.107733 |
93.75 |
11/19/10 |
|
|
29 |
|
20 |
$14,870 |
OPEN |
1350 |
55 |
$1,500 |
$53,500 |
10/26/10 |
11/03/10 |
9 |
0.136121 |
61.93 |
11/19/10 |
|
|
25 |
|
21 |
$15,900 |
FCX |
1030 |
85 |
$1,030 |
$83,970 |
10/27/10 |
11/19/10 |
24 |
0.110864 |
94.44 |
11/19/10 |
|
|
24 |
|
22 |
$16,450 |
ANN |
550 |
23 |
$550 |
$22,450 |
11/05/10 |
11/19/10 |
15 |
0.081424 |
24.44 |
11/19/10 |
|
|
15 |
|
23 |
$17,350 |
LVS |
900 |
30 |
$800 |
$29,200 |
11/08/10 |
12/06/10 |
29 |
0.446025 |
52.71 |
12/17/10 |
|
|
40 |
|
24 |
$17,950 |
PAY |
600 |
$30.0 |
$800 |
$29,200 |
40491 |
40513 |
23 |
0.165237 |
34.98 |
12/17/10 |
|
|
39 |
|
25 |
$18,800 |
CSTR |
850 |
$55.0 |
$1,500 |
$53,500 |
40497 |
40504 |
8 |
0.106397 |
59.87 |
12/17/10 |
|
|
33 |
|
26 |
$20,340 |
FCX |
1540 |
$90.0 |
$1,920 |
$88,080 |
40501 |
40513 |
13 |
0.110393 |
99.01 |
12/17/10 |
|
|
29 |
|
27 |
$21,590 |
FFIV |
1250 |
$115.0 |
$1,650 |
$113,350 |
40504 |
40513 |
10 |
0.109514 |
127.29 |
12/17/10 |
|
|
26 |
|
28 |
$20,150 |
TTM |
-1440 |
$32.0 |
$1,100 |
$30,900 |
40506 |
40513 |
8 |
0.134454 |
35.7 |
12/17/10 |
-1440 |
|
24 |
|
29 |
$20,650 |
OVTI |
500 |
$27.0 |
$650 |
$26,350 |
40506 |
40513 |
8 |
0.147249 |
30.9 |
12/17/10 |
|
|
24 |
|
30 |
$21,900 |
BIDU |
1250 |
$99.0 |
$1,550 |
$97,450 |
40508 |
40527 |
20 |
0.097936 |
108.03 |
12/17/10 |
|
|
22 |
|
31 |
$22,750 |
CSTR |
850 |
$60.0 |
$850 |
$59,150 |
40515 |
40529 |
15 |
0.075781 |
64 |
12/17/10 |
|
|
15 |
|
32 |
$24,020 |
JOYG |
1270 |
$75.0 |
$1,270 |
$73,730 |
40520 |
40529 |
10 |
0.049626 |
77.58 |
12/17/10 |
|
|
10 |
|
33 |
$24,890 |
LVS |
870 |
$40.0 |
$1,070 |
$38,930 |
40522 |
40546 |
25 |
0.154431 |
46.04 |
01/21/11 |
|
|
43 |
|
34 |
$21,590 |
VECO |
-3300 |
$44.0 |
$1,200 |
$42,800 |
40525 |
40526 |
2 |
0.150794 |
50.4 |
01/21/11 |
-3300 |
|
40 |
|
35 |
$21,990 |
OVTI |
400 |
$26.0 |
$550 |
$25,450 |
40528 |
40555 |
28 |
0.115705 |
28.78 |
01/21/11 |
|
|
37 |
|
36 |
$23,360 |
BIDU |
1370 |
$67.0 |
$1,590 |
$65,410 |
40528 |
40548 |
21 |
0.339293 |
99 |
01/21/11 |
|
|
37 |
|
37 |
$24,160 |
VECO |
800 |
$40.0 |
$950 |
$39,050 |
40532 |
40553 |
22 |
0.095437 |
43.17 |
01/21/11 |
|
|
33 |
|
38 |
$24,560 |
CSTR |
400 |
$55.0 |
$950 |
$54,050 |
40532 |
40555 |
24 |
0.107939 |
60.59 |
01/21/11 |
|
|
33 |
|
39 |
$26,210 |
FFIV |
1650 |
$125.0 |
$2,100 |
$122,900 |
40546 |
40555 |
10 |
0.098313 |
136.3 |
01/21/11 |
|
|
19 |
|
40 |
$27,010 |
APKT |
800 |
$52.5 |
$900 |
$51,600 |
40547 |
40561 |
15 |
0.107884 |
57.84 |
01/21/11 |
|
|
18 |
|
41 |
$27,510 |
FFIV |
500 |
$125.0 |
$1,850 |
$123,150 |
40548 |
40549 |
2 |
0.096014 |
136.23 |
01/21/11 |
|
|
17 |
|
42 |
$28,090 |
LVS |
580 |
$45.0 |
$710 |
$44,290 |
40549 |
40561 |
13 |
0.071294 |
47.69 |
01/21/11 |
|
|
16 |
|
43 |
$28,640 |
AAPL |
550 |
$75.0 |
$850 |
$74,150 |
40553 |
40556 |
4 |
0.070453 |
79.77 |
01/21/11 |
|
|
12 |
|
44 |
$28,859 |
AAPL |
219 |
$325.0 |
$759 |
$96,741 |
40554 |
40561 |
8 |
0.052951 |
342.37 |
01/21/11 |
|
|
11 |
|
45 |
$29,359 |
FNSR |
500 |
$28.0 |
$650 |
$27,350 |
40555 |
40575 |
21 |
0.171212 |
33 |
02/18/11 |
|
|
38 |
|
46 |
$29,959 |
CYMI |
600 |
$45.0 |
$1,100 |
$43,900 |
40561 |
40575 |
15 |
0.098192 |
48.68 |
02/18/11 |
|
|
32 |
|
47 |
$30,459 |
CRUS |
500 |
$17.0 |
$600 |
$16,400 |
40562 |
40570 |
9 |
0.103825 |
18.3 |
02/18/11 |
|
|
31 |
|
48 |
$31,119 |
BIDU |
660 |
$95.0 |
$1,460 |
$93,540 |
40564 |
40574 |
11 |
0.114372 |
105.62 |
02/18/11 |
|
|
29 |
|
49 |
$31,419 |
OVTI |
300 |
$24.0 |
$550 |
$23,450 |
40567 |
40571 |
5 |
0.110395 |
26.36 |
02/18/11 |
|
|
26 |
|
50 |
$30,219 |
TEN |
-1200 |
$40.0 |
$700 |
$39,300 |
40569 |
40576 |
8 |
0.099863 |
43.66 |
02/18/11 |
-1200 |
|
24 |
|
51 |
$31,189 |
WYNN |
970 |
$110.0 |
$1,510 |
$108,490 |
40574 |
40582 |
9 |
0.073843 |
117.14 |
02/18/11 |
|
|
19 |
|
52 |
$31,979 |
APA |
790 |
$110.0 |
$930 |
$109,070 |
40575 |
40588 |
14 |
0.086592 |
119.41 |
02/18/11 |
|
|
18 |
|
53 |
$32,629 |
FOSL |
650 |
$65.0 |
$700 |
$64,300 |
40576 |
40585 |
10 |
0.112369 |
72.44 |
02/18/11 |
|
|
17 |
|
54 |
$33,429 |
JOYG |
800 |
$85.0 |
$1,050 |
$83,950 |
40577 |
40582 |
6 |
0.062011 |
89.5 |
02/18/11 |
|
|
16 |
|
55 |
$33,829 |
CMI |
400 |
$105.0 |
$550 |
$104,450 |
40581 |
40588 |
8 |
0.064068 |
111.6 |
02/18/11 |
|
|
12 |
|
56 |
$34,149 |
BHP |
320 |
$90.0 |
$590 |
$89,410 |
40581 |
40588 |
8 |
0.061115 |
95.23 |
02/18/11 |
|
|
12 |
|
57 |
$34,499 |
ACOM |
350 |
$35.0 |
$500 |
$34,500 |
40582 |
40588 |
7 |
0.070832 |
37.13 |
02/18/11 |
|
|
11 |
|
58 |
$35,039 |
DE |
540 |
$90.0 |
$570 |
$89,430 |
40584 |
40590 |
7 |
0.051644 |
94.3 |
02/18/11 |
|
|
9 |
|
59 |
$35,259 |
WYNN |
220 |
$120.0 |
$330 |
$119,670 |
40588 |
40591 |
4 |
0.060896 |
127.43 |
02/18/11 |
|
|
5 |
|
60 |
$34,309 |
CRUS |
-950 |
$23.0 |
$700 |
$22,300 |
40589 |
40597 |
9 |
0.099717 |
24.77 |
03/18/11 |
-950 |
|
32 |
|
61 |
$33,239 |
LVS |
-1070 |
$44.0 |
$810 |
$43,190 |
40589 |
40603 |
15 |
0.103011 |
48.15 |
03/18/11 |
-1070 |
|
32 |
|
62 |
$31,589 |
NFLX |
-1650 |
$220.0 |
$1,200 |
$218,800 |
40590 |
40597 |
8 |
0.100957 |
243.37 |
03/18/11 |
-1650 |
|
31 |
|
63 |
$31,939 |
JOYG |
350 |
$90.0 |
$1,490 |
$88,510 |
40591 |
40596 |
6 |
0.098125 |
98.14 |
03/18/11 |
|
|
30 |
|
64 |
$31,489 |
RDWR |
-450 |
$36.0 |
$550 |
$35,450 |
40592 |
40609 |
18 |
0.110414 |
39.85 |
03/18/11 |
-450 |
|
29 |
|
65 |
$32,089 |
EXXI |
600 |
$30.0 |
$600 |
$29,400 |
40592 |
40620 |
29 |
0.118441 |
33.35 |
03/18/11 |
|
|
29 |
|
66 |
$33,229 |
LO |
1140 |
$72.5 |
$1,140 |
$71,360 |
40596 |
40620 |
25 |
0.10408 |
79.65 |
03/18/11 |
|
|
25 |
|
67 |
$33,529 |
DECK |
300 |
$80.0 |
$1,150 |
$78,850 |
40602 |
40618 |
17 |
0.104893 |
88.09 |
03/18/11 |
|
|
19 |
|
68 |
$32,849 |
WYNN |
-680 |
$120.0 |
$720 |
$119,280 |
40610 |
40618 |
9 |
0.068271 |
128.02 |
03/18/11 |
-680 |
|
11 |
|
69 |
$33,449 |
OVTI |
600 |
$26.0 |
$700 |
$25,300 |
40616 |
40626 |
11 |
0.171035 |
30.52 |
04/15/11 |
|
|
33 |
|
70 |
$34,769 |
CLF |
1320 |
$80.0 |
$1,590 |
$78,410 |
40620 |
40627 |
8 |
0.126351 |
89.75 |
04/15/11 |
|
|
29 |
|
71 |
$35,219 |
JKS |
450 |
$21.0 |
$550 |
$20,450 |
40623 |
40630 |
8 |
0.182 |
25 |
04/15/11 |
|
|
26 |
|
72 |
$35,869 |
GPOR |
650 |
$30.0 |
$900 |
$29,100 |
40624 |
40630 |
7 |
0.098234 |
32.27 |
04/15/11 |
|
|
25 |
|
73 |
$36,619 |
BSFT |
750 |
$40.0 |
$1,100 |
$38,900 |
40626 |
40634 |
9 |
0.134786 |
44.96 |
04/15/11 |
|
|
23 |
|
74 |
$37,509 |
CLF |
890 |
$90.0 |
$1,170 |
$88,830 |
40631 |
40637 |
7 |
0.077762 |
96.32 |
04/15/11 |
|
|
18 |
|
75 |
$37,939 |
HAL |
430 |
$47.0 |
$680 |
$46,320 |
40632 |
40637 |
6 |
0.054887 |
49.01 |
04/15/11 |
|
|
17 |
|
76 |
$38,349 |
OVTI |
410 |
$31.0 |
$600 |
$30,400 |
40637 |
40648 |
12 |
0.086813 |
33.29 |
04/15/11 |
|
|
12 |
|
77 |
$36,299 |
CLF |
-2050 |
$95.0 |
$580 |
$94,420 |
40638 |
40645 |
8 |
0.068836 |
101.4 |
05/20/11 |
-2050 |
|
46 |
|
78 |
$37,439 |
GMCR |
1140 |
$55.0 |
$1,160 |
$53,840 |
40647 |
40662 |
16 |
0.180767 |
65.72 |
05/20/11 |
|
|
37 |
|
79 |
$38,464 |
BIDU |
1025 |
$130.0 |
$1,130 |
$63,870 |
40648 |
40654 |
7 |
0.116663 |
145.89 |
05/20/11 |
|
|
36 |
|
80 |
$39,614 |
WTW |
1150 |
$65.0 |
$1,350 |
$63,650 |
40652 |
40662 |
11 |
0.159736 |
75.75 |
05/20/11 |
|
|
32 |
|
81 |
$40,064 |
SPRD |
450 |
$17.5 |
$550 |
$16,950 |
40652 |
40662 |
11 |
0.205717 |
21.34 |
05/20/11 |
|
|
32 |
|
82 |
$40,764 |
JKS |
700 |
$21.0 |
$800 |
$20,200 |
40653 |
40662 |
10 |
0.157982 |
23.99 |
05/20/11 |
|
|
31 |
|
83 |
$41,164 |
RAX |
400 |
$40.0 |
$800 |
$39,200 |
40658 |
40676 |
19 |
0.124414 |
44.77 |
05/20/11 |
|
|
26 |
|
84 |
$41,464 |
PAY |
300 |
$47.0 |
$600 |
$46,400 |
40661 |
40669 |
9 |
0.129619 |
53.31 |
05/20/11 |
|
|
23 |
|
85 |
$42,114 |
BSFT |
650 |
$40.0 |
$1,050 |
$38,950 |
40662 |
40669 |
8 |
0.143391 |
45.47 |
05/20/11 |
|
|
22 |
|
86 |
$40,514 |
PPO |
-1600 |
$65.0 |
$650 |
$64,350 |
40668 |
40676 |
9 |
0.025738 |
66.05 |
05/20/11 |
-1600 |
|
16 |
|
87 |
$41,364 |
GMCR |
850 |
$72.5 |
$850 |
$71,650 |
40672 |
40683 |
12 |
0.06827 |
76.9 |
05/20/11 |
|
|
12 |
|
88 |
$41,974 |
OXY |
610 |
$97.5 |
$610 |
$96,890 |
40674 |
40683 |
10 |
0.063412 |
103.45 |
05/20/11 |
|
|
10 |
|
89 |
$40,174 |
LULU |
-1800 |
$85.0 |
$1,600 |
$83,400 |
40681 |
40697 |
17 |
0.14811 |
97.9 |
06/17/11 |
-1800 |
|
31 |
|
90 |
$41,064 |
GMCR |
890 |
$70.0 |
$890 |
$69,110 |
40686 |
40704 |
19 |
0.11872 |
78.42 |
06/17/11 |
|
|
26 |
|
91 |
$42,064 |
SODA |
1000 |
$50.0 |
$1,500 |
$48,500 |
40687 |
40695 |
9 |
0.117379 |
54.95 |
06/17/11 |
|
|
25 |
|
92 |
$41,264 |
MW |
-800 |
$31.0 |
$600 |
$30,400 |
40687 |
40697 |
11 |
0.083509 |
33.17 |
06/17/11 |
-800 |
|
25 |
|
93 |
$40,864 |
WTW |
-400 |
$77.5 |
$1,100 |
$76,400 |
40688 |
40696 |
9 |
0.085249 |
83.52 |
06/17/11 |
-400 |
|
24 |
|
94 |
$41,804 |
WYNN |
940 |
$135.0 |
$1,530 |
$133,470 |
40689 |
40695 |
7 |
0.07486 |
144.27 |
06/17/11 |
|
|
23 |
|
95 |
$42,204 |
SODA |
400 |
$55.0 |
$900 |
$54,100 |
40701 |
40702 |
2 |
0.083362 |
59.02 |
06/17/11 |
|
|
11 |
|
96 |
$43,264 |
LO |
1060 |
$95.0 |
$1,410 |
$93,590 |
40714 |
40721 |
8 |
0.161455 |
111.61 |
07/15/11 |
|
|
26 |
|
97 |
$44,264 |
GMCR |
1000 |
$75.0 |
$1,100 |
$73,900 |
40715 |
40725 |
11 |
0.106841 |
82.74 |
07/15/11 |
|
|
25 |
|
98 |
$44,964 |
PPO |
700 |
$55.0 |
$0 |
$55,000 |
40715 |
40723 |
9 |
0.112187 |
61.95 |
07/15/11 |
|
|
25 |
|
99 |
$45,814 |
SPRD |
850 |
$9.0 |
$900 |
$8,100 |
40716 |
40725 |
10 |
0.38914 |
13.26 |
07/15/11 |
|
|
24 |
|
100 |
$46,864 |
BIDU |
1050 |
$120.0 |
$1,420 |
$118,580 |
40721 |
40724 |
4 |
0.101871 |
132.03 |
07/15/11 |
|
|
19 |
|
101 |
$45,454 |
IPGP |
-1410 |
$70.0 |
$1,000 |
$69,000 |
40725 |
40739 |
15 |
0.079386 |
74.95 |
07/15/11 |
-1410 |
|
15 |
|
102 |
$45,954 |
DDS |
500 |
$50.0 |
$550 |
$49,450 |
40725 |
40731 |
7 |
0.065041 |
52.89 |
07/15/11 |
|
|
15 |
|
103 |
$46,504 |
CMI |
550 |
$100.0 |
$550 |
$99,450 |
40729 |
40739 |
11 |
0.060818 |
105.89 |
07/15/11 |
|
|
11 |
|
104 |
$46,954 |
V |
450 |
$82.5 |
$490 |
$82,010 |
40730 |
40737 |
8 |
0.070498 |
88.23 |
07/15/11 |
|
|
10 |
|
105 |
$46,704 |
ZAGG |
-250 |
$12.5 |
$850 |
$11,650 |
40742 |
40760 |
19 |
0.257962 |
15.7 |
08/19/11 |
-250 |
|
33 |
|
106 |
$44,954 |
CSTR |
-1750 |
$50.0 |
$1,000 |
$49,000 |
40742 |
40753 |
12 |
0.150633 |
57.69 |
08/19/11 |
-1750 |
|
33 |
|
107 |
$41,904 |
SOHU |
-3050 |
$70.0 |
$1,250 |
$68,750 |
40743 |
40760 |
18 |
0.17328 |
83.16 |
08/19/11 |
-3050 |
|
32 |
|
108 |
$36,454 |
PPO |
-5450 |
$60.0 |
$950 |
$59,050 |
40745 |
40760 |
16 |
0.161579 |
70.43 |
08/19/11 |
-5450 |
|
30 |
|
109 |
$37,304 |
LULU |
850 |
$38.8 |
$850 |
$37,900 |
40780 |
40795 |
16 |
0.242303 |
50.02 |
09/16/11 |
|
|
23 |
|
110 |
$38,544 |
GMCR |
1240 |
$90.0 |
$1,240 |
$88,760 |
40787 |
40795 |
9 |
0.150378 |
104.47 |
09/16/11 |
|
|
16 |
|
111 |
$39,314 |
BIDU |
770 |
$120.0 |
$770 |
$119,230 |
40793 |
40802 |
10 |
0.164119 |
142.64 |
09/16/11 |
|
|
10 |
|
112 |
$39,964 |
DECK |
650 |
$90.0 |
$650 |
$89,350 |
40799 |
40802 |
4 |
0.066158 |
95.68 |
09/16/11 |
|
|
4 |
|
113 |
$40,634 |
MA |
670 |
$315.0 |
$670 |
$314,330 |
40800 |
40802 |
3 |
0.057538 |
333.52 |
09/16/11 |
|
|
3 |
|
114 |
$41,764 |
GMCR |
1130 |
$80.0 |
$1,580 |
$78,420 |
40801 |
40830 |
30 |
0.257808 |
105.66 |
10/21/11 |
|
|
37 |
|
115 |
$40,214 |
CROX |
-1550 |
$23.0 |
$500 |
$22,500 |
40802 |
40816 |
15 |
0.201845 |
28.19 |
10/21/11 |
-1550 |
|
36 |
|
116 |
$41,164 |
UA |
950 |
$62.5 |
$1,100 |
$61,400 |
40805 |
40823 |
19 |
0.209171 |
77.64 |
10/21/11 |
|
|
33 |
|
117 |
$36,414 |
COG |
-4750 |
$62.5 |
$1,150 |
$61,350 |
40806 |
40809 |
4 |
0.168699 |
73.8 |
10/21/11 |
-4750 |
|
32 |
|
118 |
$37,264 |
DECK |
850 |
$85.0 |
$850 |
$84,150 |
40822 |
40830 |
9 |
0.168889 |
101.25 |
10/21/11 |
|
|
16 |
|
119 |
$38,764 |
TPX |
1500 |
$55.0 |
$1,500 |
$53,500 |
40827 |
40830 |
4 |
0.104303 |
59.73 |
10/21/11 |
|
|
11 |
|
120 |
$36,619 |
GMCR |
-2145 |
$45.0 |
$610 |
$44,390 |
40835 |
40857 |
23 |
0.462265 |
82.55 |
11/18/11 |
-2145 |
|
31 |
|
121 |
$37,519 |
BIDU |
900 |
$85.0 |
$950 |
$84,050 |
40837 |
40837 |
1 |
0.308742 |
121.59 |
11/18/11 |
|
|
29 |
|
122 |
$38,369 |
DECK |
850 |
$85.0 |
$1,000 |
$84,000 |
40840 |
40844 |
5 |
0.216199 |
107.17 |
11/18/11 |
|
|
26 |
|
123 |
$38,969 |
SPRD |
600 |
$22.0 |
$650 |
$21,350 |
40843 |
40851 |
9 |
0.140499 |
24.84 |
11/18/11 |
|
|
23 |
|
124 |
$39,569 |
HANS |
600 |
$70.0 |
$650 |
$69,350 |
40850 |
40855 |
6 |
0.215498 |
88.4 |
11/18/11 |
|
|
16 |
|
125 |
$40,069 |
NOV |
500 |
$60.0 |
$500 |
$59,500 |
40851 |
40858 |
8 |
0.162208 |
71.02 |
11/18/11 |
|
|
15 |
|
126 |
$40,569 |
COG |
500 |
$72.5 |
$500 |
$72,000 |
40854 |
40865 |
12 |
0.135965 |
83.33 |
11/18/11 |
|
|
12 |
|
127 |
$41,069 |
HAL |
500 |
$30.0 |
$550 |
$29,450 |
40856 |
40882 |
27 |
0.20982 |
37.27 |
12/16/11 |
|
|
38 |
|
128 |
$41,629 |
LVS |
560 |
$37.0 |
$620 |
$36,380 |
40858 |
40877 |
20 |
0.195311 |
45.21 |
12/16/11 |
|
|
36 |
|
129 |
$42,129 |
LULU |
500 |
$40.0 |
$600 |
$39,400 |
40861 |
40882 |
22 |
0.272257 |
54.14 |
12/16/11 |
|
|
33 |
|
130 |
$43,069 |
BIDU |
940 |
$105.0 |
$1,020 |
$103,980 |
40875 |
40883 |
9 |
0.173516 |
125.81 |
12/16/11 |
|
|
19 |
|
131 |
$44,629 |
LO |
1560 |
$97.5 |
$1,700 |
$95,800 |
40877 |
40886 |
10 |
0.133581 |
110.57 |
12/16/11 |
|
|
17 |
|
132 |
$45,229 |
HANS |
600 |
$85.0 |
$700 |
$84,300 |
40879 |
40886 |
8 |
0.101567 |
93.83 |
12/16/11 |
|
|
15 |
|
133 |
$44,279 |
PII |
-950 |
$57.5 |
$550 |
$56,950 |
40882 |
40885 |
4 |
0.079968 |
61.9 |
12/16/11 |
-950 |
|
12 |
|
134 |
$43,229 |
CAT |
-1050 |
$87.5 |
$550 |
$86,950 |
40884 |
40891 |
8 |
0.080478 |
94.56 |
12/16/11 |
-1050 |
|
10 |
|
135 |
$44,389 |
FFIV |
1160 |
$85.0 |
$1,260 |
$83,740 |
40896 |
40919 |
24 |
0.19643 |
104.21 |
01/18/12 |
|
|
31 |
|
136 |
$44,989 |
VRX |
600 |
$42.0 |
$650 |
$41,350 |
40911 |
40921 |
11 |
0.14336 |
48.27 |
01/18/12 |
|
|
16 |
|
137 |
$45,599 |
LULU |
610 |
$48.8 |
$660 |
$48,090 |
40917 |
40919 |
3 |
0.003729 |
48.27 |
01/18/12 |
|
|
10 |
|
138 |
$46,199 |
QCOR |
600 |
$30.0 |
$750 |
$29,250 |
40920 |
40921 |
2 |
0.153891 |
34.57 |
01/18/12 |
|
|
7 |
|
139 |
$47,349 |
WTW |
1150 |
$57.5 |
$1,150 |
$56,350 |
40931 |
40956 |
26 |
0.195689 |
70.06 |
02/17/12 |
|
|
26 |
|
140 |
$47,999 |
VPHM |
650 |
$25.0 |
$650 |
$24,350 |
40931 |
40956 |
26 |
0.161501 |
29.04 |
02/17/12 |
|
|
26 |
|
141 |
$49,549 |
EQIX |
1550 |
$105.0 |
$1,550 |
$103,450 |
40933 |
40956 |
24 |
0.11498 |
116.89 |
02/17/12 |
|
|
24 |
|
142 |
$50,099 |
RAX |
550 |
$37.0 |
$550 |
$36,450 |
40938 |
40956 |
19 |
0.14677 |
42.72 |
02/17/12 |
|
|
19 |
|
143 |
$51,299 |
CLR |
1200 |
$65.0 |
$1,250 |
$63,750 |
40951 |
40962 |
12 |
0.172078 |
77 |
03/16/12 |
|
|
34 |
|
144 |
$51,749 |
NOG |
450 |
$18.0 |
$550 |
$17,450 |
40954 |
40968 |
15 |
0.26773 |
23.83 |
03/16/12 |
|
|
31 |
|
145 |
$52,459 |
ESRX |
710 |
$47.5 |
$710 |
$46,790 |
40963 |
40984 |
22 |
0.106208 |
52.35 |
03/16/12 |
|
|
22 |
|
146 |
$53,109 |
URI |
650 |
$37.0 |
$650 |
$36,350 |
40989 |
41019 |
31 |
0.141271 |
42.33 |
04/20/12 |
|
|
31 |
|
147 |
$55,029 |
FFIV |
1920 |
$120.0 |
$1,920 |
$118,080 |
40994 |
41019 |
26 |
0.115704 |
133.53 |
04/20/12 |
|
|
26 |
|
148 |
$55,529 |
QCOR |
500 |
$34.0 |
$700 |
$33,300 |
41001 |
41009 |
9 |
0.110577 |
37.44 |
04/20/12 |
|
|
19 |
|
149 |
$54,519 |
STX |
-1010 |
$26.0 |
$630 |
$25,370 |
41002 |
41005 |
4 |
0.08741 |
27.8 |
04/20/12 |
-1010 |
|
18 |
|
150 |
$55,119 |
CLR |
600 |
$80.0 |
$800 |
$79,200 |
41003 |
41012 |
10 |
0.068783 |
85.05 |
04/20/12 |
|
|
17 |
|
151 |
$54,019 |
WDC |
-1100 |
$39.0 |
$930 |
$38,070 |
41018 |
41026 |
9 |
0.102757 |
42.43 |
05/18/12 |
-1100 |
|
30 |
|
152 |
$54,489 |
LVS |
470 |
$41.0 |
$620 |
$40,380 |
41039 |
41066 |
28 |
0.138652 |
46.88 |
06/15/12 |
|
|
37 |
|
153 |
$55,189 |
HLF |
700 |
$37.5 |
$700 |
$36,800 |
41039 |
41047 |
9 |
0.208091 |
46.47 |
05/18/12 |
|
|
9 |
|
154 |
$55,739 |
KORS |
550 |
$33.0 |
$600 |
$32,400 |
41054 |
41074 |
21 |
0.214355 |
41.24 |
06/15/12 |
|
|
22 |
|
155 |
$56,219 |
LULU |
480 |
$62.5 |
$830 |
$61,670 |
41058 |
41071 |
14 |
0.17021 |
74.32 |
06/15/12 |
|
|
18 |
|
156 |
$56,669 |
STX |
450 |
$20.0 |
$500 |
$19,500 |
41072 |
41096 |
25 |
0.190871 |
24.1 |
07/20/12 |
|
|
39 |
|
157 |
$57,269 |
CRUS |
600 |
$24.0 |
$750 |
$23,250 |
41072 |
41095 |
24 |
0.180183 |
28.36 |
07/20/12 |
|
|
39 |
|
158 |
$57,869 |
KORS |
600 |
$37.0 |
$750 |
$36,250 |
41079 |
41096 |
18 |
0.123125 |
41.34 |
07/20/12 |
|
|
32 |
|
159 |
$58,669 |
MNST |
800 |
$62.5 |
$800 |
$61,700 |
41089 |
41110 |
22 |
0.138749 |
71.64 |
07/20/12 |
|
|
22 |
|
160 |
$59,119 |
CALL |
450 |
$15.0 |
$600 |
$14,400 |
41106 |
41115 |
10 |
0.30131 |
20.61 |
08/17/12 |
|
|
33 |
|
161 |
$59,719 |
QCOR |
600 |
$35.0 |
$1,200 |
$33,800 |
41108 |
41115 |
8 |
0.220659 |
43.37 |
08/17/12 |
|
|
31 |
|
162 |
$60,469 |
KORS |
750 |
$35.0 |
$750 |
$34,250 |
41116 |
41138 |
23 |
0.182968 |
41.92 |
08/17/12 |
|
|
23 |
|
163 |
$61,069 |
VRX |
600 |
$40.0 |
$650 |
$39,350 |
41120 |
41130 |
11 |
0.194143 |
48.83 |
08/17/12 |
|
|
19 |
|
164 |
$61,669 |
MNST |
600 |
$55.0 |
$800 |
$54,200 |
41129 |
41130 |
2 |
0.203761 |
68.07 |
08/17/12 |
|
|
10 |
|
165 |
$62,269 |
QCOR |
600 |
$30.0 |
$650 |
$29,350 |
41134 |
41156 |
23 |
0.235677 |
38.4 |
09/21/12 |
|
|
40 |
|
166 |
$63,369 |
NUS |
1100 |
$35.0 |
$1,150 |
$33,850 |
41136 |
41164 |
29 |
0.207631 |
42.72 |
09/21/12 |
|
|
38 |
|
167 |
$64,169 |
CRUS |
800 |
$38.0 |
$800 |
$37,200 |
41145 |
41173 |
29 |
0.112172 |
41.9 |
09/21/12 |
|
|
29 |
|
168 |
$64,709 |
BBBY |
540 |
$60.0 |
$540 |
$59,460 |
41156 |
41173 |
18 |
0.104518 |
66.4 |
09/21/12 |
|
|
18 |
|
169 |
$64,309 |
IPGP |
-400 |
$60.0 |
$600 |
$59,400 |
41163 |
41172 |
10 |
0.066625 |
63.64 |
09/21/12 |
-400 |
|
11 |
|
170 |
$64,959 |
CRUS |
650 |
$34.0 |
$650 |
$33,350 |
41177 |
41201 |
25 |
0.143334 |
38.93 |
10/19/12 |
|
|
25 |
|
171 |
$65,459 |
SCSS |
500 |
$30.0 |
$700 |
$29,300 |
41191 |
41200 |
10 |
0.102878 |
32.66 |
10/19/12 |
|
|
11 |
|
172 |
$63,809 |
MELI |
-1650 |
$77.5 |
$1,200 |
$76,300 |
41199 |
41221 |
23 |
0.16803 |
91.71 |
11/16/12 |
-1650 |
|
31 |
|
173 |
$64,409 |
CRUS |
600 |
$32.0 |
$850 |
$31,150 |
41201 |
41215 |
15 |
0.192377 |
38.57 |
11/16/12 |
|
|
29 |
|
174 |
$65,239 |
LULU |
830 |
$62.5 |
$870 |
$61,630 |
41240 |
41255 |
16 |
0.145807 |
72.15 |
12/21/12 |
|
|
25 |
|
175 |
$65,889 |
DDD |
650 |
$40.0 |
$750 |
$39,250 |
41247 |
41255 |
9 |
0.103881 |
43.8 |
12/21/12 |
|
|
18 |
|
176 |
$66,439 |
DDD |
550 |
$45.0 |
$600 |
$44,400 |
41267 |
41277 |
11 |
0.150239 |
52.25 |
01/18/13 |
|
|
26 |
|
177 |
$66,939 |
KORS |
500 |
$46.0 |
$550 |
$45,450 |
41276 |
41290 |
15 |
0.114898 |
51.35 |
01/18/13 |
|
|
17 |
|
178 |
$67,739 |
NUS |
800 |
$35.0 |
$850 |
$34,150 |
41277 |
41288 |
12 |
0.113678 |
38.53 |
01/18/13 |
|
|
16 |
|
179 |
$68,569 |
LULU |
830 |
$67.5 |
$1,030 |
$66,470 |
41288 |
41290 |
3 |
0.074105 |
71.79 |
01/18/13 |
|
|
5 |
|
180 |
$69,069 |
GMCR |
500 |
$28.0 |
$590 |
$27,410 |
41289 |
41298 |
10 |
0.300408 |
39.18 |
02/15/13 |
|
|
32 |
|
181 |
$69,769 |
KORS |
700 |
$45.0 |
$750 |
$44,250 |
41290 |
41318 |
29 |
0.169794 |
53.3 |
02/15/13 |
|
|
31 |
|
182 |
$70,619 |
EXPE |
850 |
$55.0 |
$900 |
$54,100 |
41297 |
41311 |
15 |
0.13523 |
62.56 |
02/15/13 |
|
|
24 |
|
183 |
$71,799 |
GMCR |
1180 |
$37.0 |
$1,230 |
$35,770 |
41299 |
41313 |
15 |
0.205993 |
45.05 |
02/15/13 |
|
|
22 |
|
184 |
$72,099 |
TRIP |
300 |
$41.0 |
$600 |
$40,400 |
41303 |
41318 |
16 |
0.120592 |
45.94 |
02/15/13 |
|
|
18 |
|
185 |
$73,239 |
LNKD |
1140 |
$110.0 |
$1,150 |
$108,850 |
41306 |
41313 |
8 |
0.123167 |
124.14 |
02/15/13 |
|
|
15 |
|
186 |
$73,759 |
ANF |
520 |
$47.5 |
$520 |
$46,980 |
41310 |
41313 |
4 |
0.078643 |
50.99 |
02/15/13 |
|
|
11 |
|
187 |
$74,259 |
FRAN |
500 |
$22.5 |
$600 |
$21,900 |
41324 |
41339 |
16 |
0.188288 |
26.98 |
03/15/13 |
|
|
25 |
|
188 |
$75,029 |
ANF |
770 |
$45.0 |
$1,080 |
$43,920 |
41325 |
41339 |
15 |
0.154409 |
51.94 |
03/15/13 |
|
|
24 |
|
189 |
$75,679 |
KORS |
650 |
$55.0 |
$650 |
$54,350 |
41327 |
41348 |
22 |
0.086401 |
59.49 |
03/15/13 |
|
|
22 |
|
190 |
$76,229 |
NSM |
550 |
$35.0 |
$650 |
$34,350 |
41330 |
41339 |
10 |
0.098898 |
38.12 |
03/15/13 |
|
|
19 |
|
191 |
$76,779 |
GMCR |
550 |
$49.0 |
$550 |
$48,450 |
$41,341 |
$41,348 |
800.00% |
0.06141 |
51.62 |
03/15/13 |
|
|
8 |
|
192 |
$77,179 |
HLF |
$400 |
$32.0 |
$550 |
$31,450 |
03/21/13 |
4/15/2013 |
26 |
15.80% |
$37.35 |
04/19/13 |
|
|
30 |
|
193 |
$77,869 |
EBAY |
$690 |
$50.0 |
$760 |
$49,240 |
03/22/13 |
4/15/2013 |
25 |
7.27% |
$53.10 |
04/19/13 |
|
|
29 |
|
194 |
$78,499 |
GMCR |
$630 |
$50.0 |
$710 |
$49,290 |
03/25/13 |
4/5/2013 |
12 |
11.43% |
$55.65 |
04/19/13 |
|
|
26 |
|
195 |
$78,919 |
SNDK |
$420 |
$50.0 |
$600 |
$49,400 |
03/28/13 |
4/17/2013 |
21 |
9.77% |
$54.75 |
04/19/13 |
|
|
23 |
|
196 |
$79,399 |
NFLX |
$480 |
$150.0 |
$550 |
$149,450 |
04/11/13 |
4/15/2013 |
5 |
12.18% |
$170.18 |
04/19/13 |
|
|
9 |
|
197 |
$75,199 |
IBM |
($4,200) |
$200.0 |
$800 |
$199,200 |
04/12/13 |
4/19/2013 |
8 |
5.38% |
$210.52 |
04/19/13 |
-4200 |
|
8 |
|
198 |
$75,839 |
GMCR |
$640 |
$40.0 |
$640 |
$39,360 |
04/18/13 |
5/17/2013 |
30 |
28.71% |
$55.21 |
05/17/13 |
|
|
30 |
|
199 |
$76,389 |
TPX |
$550 |
$41.0 |
$550 |
$40,450 |
04/26/13 |
5/17/2013 |
22 |
16.92% |
$48.69 |
05/17/13 |
|
|
22 |
|
200 |
$76,819 |
NFLX |
$430 |
$190.0 |
$430 |
$189,570 |
05/06/13 |
5/17/2013 |
12 |
10.60% |
$212.05 |
05/17/13 |
|
|
12 |
|
201 |
$76,819 |
EXP |
$0 |
$67.5 |
$500 |
$67,000 |
05/13/13 |
5/17/2013 |
5 |
6.48% |
$71.64 |
05/17/13 |
|
|
5 |
|
202 |
$77,519 |
VRX |
$700 |
$80.0 |
$700 |
$79,300 |
06/07/13 |
6/21/2013 |
15 |
7.47% |
$85.70 |
06/21/13 |
|
|
15 |
|
203 |
$78,319 |
SODA |
$800 |
$67.5 |
$800 |
$66,700 |
06/10/13 |
6/21/2013 |
12 |
7.73% |
$72.29 |
06/21/13 |
|
|
12 |
|
204 |
$78,769 |
MYGN |
$450 |
$30.0 |
$500 |
$29,500 |
06/12/13 |
6/13/2013 |
2 |
12.95% |
$33.89 |
06/21/13 |
|
|
10 |
|
205 |
$79,439 |
YRCW |
$670 |
$25.0 |
$670 |
$24,330 |
07/01/13 |
7/19/2013 |
19 |
28.21% |
$33.89 |
07/19/13 |
|
|
19 |
|
206 |
$80,769 |
NFLX |
$1,330 |
$200.0 |
$1,380 |
$198,620 |
07/05/13 |
7/11/2013 |
7 |
10.21% |
$221.21 |
07/19/13 |
|
|
15 |
|
207 |
$81,319 |
SNDK |
$550 |
$55.0 |
$560 |
$54,440 |
07/08/13 |
7/18/2013 |
11 |
9.55% |
$60.19 |
07/19/13 |
|
|
12 |
|
208 |
$81,829 |
HLF |
$510 |
$46.0 |
$560 |
$45,440 |
07/09/13 |
7/15/2013 |
7 |
6.52% |
$48.61 |
07/19/13 |
|
|
11 |
|
209 |
$79,530 |
SHW |
($2,299) |
$170.0 |
$700 |
$169,300 |
07/15/13 |
7/18/2013 |
4 |
8.72% |
$185.48 |
07/19/13 |
-2299 |
|
5 |
|
210 |
$80,380 |
WHR |
$850 |
$115.0 |
$850 |
$114,150 |
07/15/13 |
7/19/2013 |
5 |
7.79% |
$123.80 |
07/19/13 |
|
|
5 |
|
211 |
$81,080 |
KORS |
$700 |
$62.5 |
$750 |
$61,750 |
08/02/13 |
8/9/2013 |
8 |
10.22% |
$68.78 |
08/16/13 |
|
|
15 |
|
212 |
$81,630 |
QCOR |
$550 |
$57.5 |
$550 |
$56,950 |
08/05/13 |
8/16/2013 |
12 |
14.05% |
$66.26 |
08/16/13 |
|
|
12 |
|
213 |
$82,150 |
CREE |
$520 |
$62.5 |
$590 |
$61,910 |
08/08/13 |
8/13/2013 |
6 |
14.31% |
$72.25 |
08/16/13 |
|
|
9 |
|
214 |
$82,650 |
NQ |
$500 |
$15.0 |
$550 |
$14,450 |
08/28/13 |
9/12/2013 |
16 |
13.89% |
$16.78 |
09/20/13 |
|
|
24 |
|
215 |
$84,100 |
EOG |
$1,450 |
$150.0 |
$1,500 |
$148,500 |
08/30/13 |
9/16/2013 |
18 |
5.54% |
$157.21 |
09/20/13 |
|
|
22 |
|
216 |
$84,750 |
KORS |
$650 |
$70.0 |
$750 |
$69,250 |
08/30/13 |
9/17/2013 |
19 |
6.15% |
$73.79 |
09/20/13 |
|
|
22 |
|
217 |
$85,440 |
GMCR |
$690 |
$75.0 |
$740 |
$74,260 |
09/03/13 |
9/16/2013 |
14 |
14.20% |
$86.55 |
09/20/13 |
|
|
18 |
|
218 |
$86,240 |
BIIB |
$800 |
$210.0 |
$900 |
$209,100 |
09/10/13 |
9/17/2013 |
8 |
7.83% |
$226.86 |
09/20/13 |
|
|
11 |
|
219 |
$86,940 |
HLF |
$700 |
$55.0 |
$860 |
$54,140 |
09/23/13 |
9/27/2013 |
5 |
21.07% |
$68.59 |
10/18/13 |
|
|
26 |
|
220 |
$87,340 |
CZR |
$400 |
$17.5 |
$450 |
$17,050 |
09/24/13 |
######## |
23 |
26.73% |
$23.27 |
10/18/13 |
|
|
25 |
|
221 |
$87,740 |
NQ |
$400 |
$18.0 |
$450 |
$17,550 |
09/25/13 |
######## |
21 |
26.35% |
$23.83 |
10/18/13 |
|
|
24 |
|
222 |
$88,390 |
QCOR |
$650 |
$44.0 |
$650 |
$43,350 |
09/25/13 |
######## |
24 |
24.04% |
$57.07 |
10/18/13 |
|
|
24 |
|
223 |
$88,850 |
HLF |
$460 |
$45.0 |
$510 |
$44,490 |
10/21/13 |
######## |
22 |
31.53% |
$64.98 |
11/15/13 |
|
|
26 |
|
224 |
$89,240 |
UBNT |
$390 |
$28.0 |
$450 |
$27,550 |
10/22/13 |
11/8/2013 |
18 |
30.55% |
$39.67 |
11/15/13 |
|
|
25 |
|
225 |
$90,540 |
SFUN |
$1,300 |
$45.0 |
$1,350 |
$43,650 |
10/23/13 |
######## |
20 |
18.47% |
$53.54 |
11/15/13 |
|
|
24 |
|
226 |
$90,640 |
INVN |
$100 |
$16.0 |
$450 |
$15,550 |
10/24/13 |
11/4/2013 |
12 |
18.80% |
$19.15 |
11/15/13 |
|
|
23 |
|
227 |
$91,190 |
QIHU |
$550 |
$65.0 |
$600 |
$64,400 |
10/29/13 |
######## |
14 |
21.61% |
$82.15 |
11/15/13 |
|
|
18 |
|
228 |
$91,740 |
SFUN |
$550 |
$55.0 |
$600 |
$54,400 |
11/27/13 |
######## |
21 |
16.35% |
$65.03 |
12/20/13 |
|
|
24 |
|
229 |
$92,356 |
NFLX |
$616 |
$330.0 |
$636 |
$98,364 |
11/29/13 |
######## |
19 |
9.92% |
$365.63 |
12/20/13 |
|
|
22 |
|
230 |
$93,006 |
HLF |
$650 |
$62.5 |
$670 |
$61,830 |
12/12/13 |
######## |
6 |
10.55% |
$69.12 |
12/20/13 |
|
|
9 |
|
231 |
$93,806 |
QCOR |
$800 |
$40.0 |
$850 |
$39,150 |
12/23/13 |
1/15/2014 |
24 |
27.00% |
$53.63 |
01/17/14 |
|
|
26 |
|
232 |
$94,406 |
SFUN |
$600 |
$70.0 |
$650 |
$69,350 |
12/24/13 |
1/7/2014 |
15 |
16.87% |
$83.42 |
01/17/14 |
|
|
25 |
|
233 |
$95,206 |
YY |
$800 |
$45.0 |
$850 |
$44,150 |
12/26/13 |
1/7/2014 |
13 |
11.38% |
$49.82 |
01/17/14 |
|
|
23 |
|
234 |
$96,046 |
HLF |
$840 |
$67.5 |
$840 |
$66,660 |
12/26/13 |
1/17/2014 |
23 |
15.14% |
$78.55 |
01/17/14 |
|
|
23 |
|
235 |
$96,946 |
GMCR |
$900 |
$70.0 |
$950 |
$69,050 |
12/27/13 |
1/9/2014 |
14 |
9.04% |
$75.91 |
01/17/14 |
|
|
22 |
|
236 |
$97,446 |
QIHU |
$500 |
$72.5 |
$550 |
$71,950 |
12/31/13 |
1/15/2014 |
16 |
12.54% |
$82.27 |
01/17/14 |
|
|
18 |
|
237 |
$99,546 |
DECK |
$2,100 |
$81.0 |
$600 |
$80,400 |
01/13/14 |
2/10/2014 |
29 |
7.48% |
$86.90 |
01/17/14 |
($5,380) |
x |
5 |
|
238 |
$100,196 |
QIHU |
$650 |
$72.5 |
$700 |
$71,800 |
01/21/14 |
2/8/2014 |
19 |
22.97% |
$93.21 |
02/21/14 |
|
|
32 |
|
239 |
$100,646 |
YY |
$450 |
$45.0 |
$500 |
$44,500 |
01/27/14 |
2/11/2014 |
16 |
20.01% |
$55.63 |
02/21/14 |
|
|
26 |
|
240 |
$101,446 |
KORS |
$800 |
$70.0 |
$850 |
$69,150 |
01/28/14 |
2/4/2014 |
8 |
15.69% |
$82.02 |
02/21/14 |
|
|
25 |
|
241 |
$102,126 |
SFUN |
$680 |
$70.0 |
$730 |
$69,270 |
01/29/14 |
2/19/2014 |
22 |
15.83% |
$82.30 |
02/21/14 |
|
|
24 |
|
242 |
$103,386 |
GMCR |
$1,260 |
$67.5 |
$1,280 |
$66,220 |
01/30/14 |
2/6/2014 |
8 |
14.71% |
$77.64 |
02/21/14 |
|
|
23 |
|
243 |
$104,286 |
VRX |
$900 |
$120.0 |
$950 |
$119,050 |
02/03/14 |
2/20/2014 |
18 |
11.91% |
$135.14 |
02/21/14 |
|
|
19 |
|
244 |
$105,506 |
TSLA |
$1,220 |
$150.0 |
$1,230 |
$148,770 |
02/10/14 |
2/20/2014 |
11 |
22.88% |
$192.90 |
02/21/14 |
|
|
12 |
|
245 |
|
|
|
|
|
|
|
|
|
|
|
|
|
|
|
Interesting Article on Naked Puts
(02/25/09)
A reader (Barbara N.) sent me an interesting article today, one that
addresses a strategy designed to reduce the risk of a Naked Put strategy.
Essentially, one writes a Put for half the position desired, then if shares are
put, one writes both a Call (covered by the shares acquired through the Put) and another Put
for the second half of the position. If one ends up with a full position,
the basis will be substantially reduced by the two Puts' and one Call's premium.
Read the article for further details.

|