I want to introduce some of the fundamental metrics that I monitor at TSM. I think that you will be impressed by their importance to longer-term
returns, and since that’s what drives institutional interest, our trading
safety net, these metrics are fundamental to picking TSM stocks over the
short term as well.
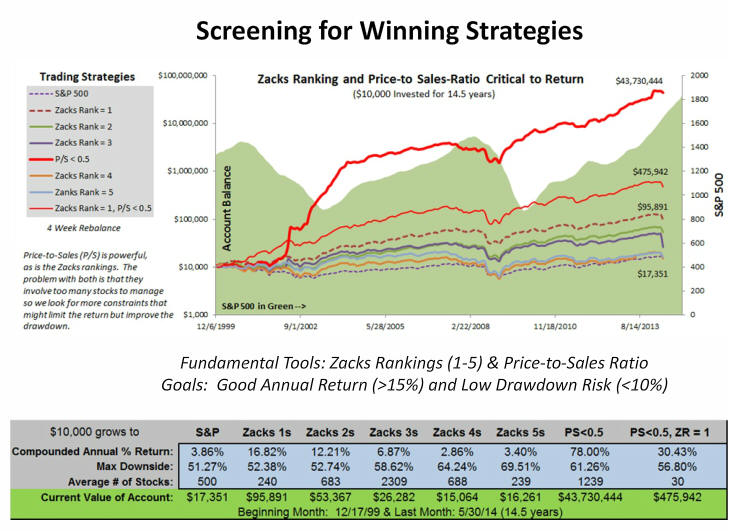
Here, I’m testing over a 14 and a half year period starting in December 1999
and ending in May of 2014, through both good times and bad (the green
background above tracks the S&P). Each four weeks, I pick a new portfolio of
stocks that meet one of the seven criteria shown in the table. I then would
hold that portfolio for four weeks before liquidating it and building a new
one. From that point on, I would buy a new group every four weeks. Of
course, all of this trading is hypothetical, and the data in the table
represents the average one could expect from starting on all possible weeks.
Note, the growth in each portfolio (the Y axis), is on a log scale, which
means the rate of growth (slopes of the various lines) are comparable, i.e.,
there is just as much movement on the Y axis of a portfolio building from
$10,000 to $100,000 as there is in one building from $100,000 to one
million. Clearly, the benefit of the best performer here, the thick red
line took place in the 2001 recovery where the slope of the line is much
steeper. From then on, the slope is still steeper but only slightly so.
In this video, I’ll assess the results from two fundamental metrics, both
indicative of quality stocks with strong earnings potential: the Zacks 1 to
5 ranking (best to worst based on proprietary earnings criteria) and the
Price-to-Sales ratio, something Ken Fisher wrote about in his 1984 book
Super Stocks
and James O’Shaughnessy further quantified in his 2004 book
What Works on Wall Street.
As seen in the table, on average, Zacks #1 ranked stocks returned a
compounded annual return of 16.82% for the entire 14.5 years. Starting with
$10,000, that account would have grown to $95,891, but there are two
downsides: you have to deal with 240 stocks each period, and you would have
had to experience 52.4% drawdown during the 2008 market downturn. Not many
of us can do either, so I continue to screen with criteria that require
fewer stocks and have far less downside risk. Ideally, I would like to deal
with 10-20 stocks and a max of 10% downside risk. Further, I’m willing to
take a far lower return in exchange.
Over the same period, the S&P returned 3.9%, which is slightly better than
Zacks #5 ranked stocks, and would have grown an account to $17,351 (the #1
ranked stocks grew 5.5 times as much cash). Obviously, Zacks rankings are
powerful, even over a month’s time.
Having shown the power of the Zacks ranking, let’s look at something way
more powerful: the price-to-sales ratio. If my only screening criteria was
limiting the price-to-sales ratio to being lower than 0.5 or paying 50 cents
for every dollar in sales, the company receives, over the same 14.5 years,
my $10,000 account would have grown to $43.7 million dollars, a 78%
compounded annual return, albeit while experiencing a 61% drawdown move
during the 2008 pullback and having to deal with 1239 stocks on average each
period. Still too much downside and too many stocks, though the profit
opportunity is unbelievable.
If I were to add a Zacks 1 ranking to the Price-to-Sales constraint, the
annual return drops to a more than respectable 30.43% return, and it would
require a much more reasonable 30 stocks while growing the $10,000 to
$475,942. It did, however, still experience a way to large 56.8% drawdown.
Other price moving factors have shown similar potential: recent upgrades in
earnings estimates, tracking fundamentally good stocks with recent price
momentum and combinations with price-to-sales and Zacks rankings. Further,
there are a number of possible stop-loss strategies to use to minimize
drawdown: get out of the market when your portfolio has dropped 10%
(reenter when two paper traded monthly portfolios have been positive); get
out of the market when the 50-day moving average of the S&P falls below its
200 moving average.
There you have it, two great screening criteria – both fundamentally based.
The next step is to reduce the drawdown risk. Until next time, this has
been Ric Miller of TripleScreen, looking for better criteria to pick stocks
for short-term buys and longer-term Puts.
|
|