Hi
everyone. This is Ric Miller again talking about TripleScreenMethod’s
investment and trading
strategies.
I’m
going to spend the next few minutes
describing
my favorite strategy:
selling
deep
out-of-the-money Puts for income.
It’s a
conservative strategy designed to give one a consistent return on a pile of
money – something that you’re not going to find with many other vehicles
today.
Let’s
say you have $1 million dollars saved that you hope can provide income for
the rest of your life. As I speak, you could buy a 1 yr CD that yields
1.1%. That vehicle would provide you $11,000 to live on for the year. Not
many of us could live off of just that interest so what happens? You start
to eat your capital, and before you know it you’re broke.
That’s
why I’ve combined TSM stock picking, based on stock fundamentals and value,
with an option approach that will provide conservatively a 10% plus return
on your pile of cash: or here, $100,000 to $150,000 a year
on your $1,000,000.
In this
presentation,
I’ll explain the strategy and its metrics (annual yield and % downside
protection) and show you how to calculate them. Further, I’ll show you how
I select the ones I personally trade.
In later lessons, I’ll discuss ways to minimize a loss when the trade goes
bad, which occurs ~ 5% of the time.
So lets get started with just what is a Put? Well, a Put is one of two
types of options, and they are available on nearly all TSM stocks and trade
just like the stocks themselves do.
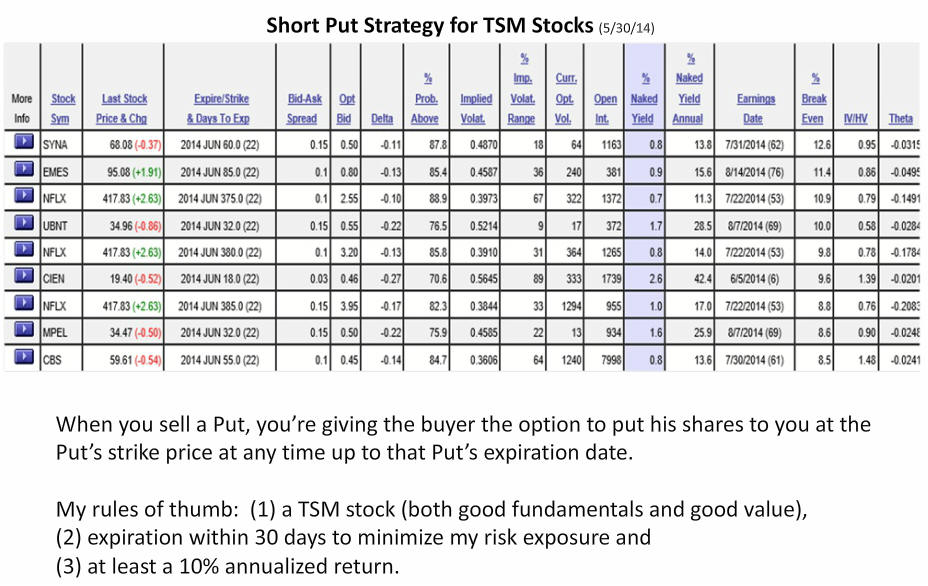
When you sell a Put (a contract usually on a hundred shares), you give the
buyer of that Put the right, but not the obligation, to put his shares to
you at the Put’s strike price. And he or she can do this at any time up
until that options expiration date. In effect, you become an insurance
policy for his stock blowing up. And for that he pays you a premium. The
Put buyer’s actions are very similar to his buying insurance for his home
where he pays a premium for protection from it burning down: the strike is
the insured price of the home and the expiration date is the life of the
policy. Think of my short-Put strategy as you becoming the insurance
company.
My rules of thumb for the short Put trade: (1) I use Puts for TSM stocks
which have both good fundamentals and good value remaining, to ensure lots
of institutional support as a safety net; (2) I only sell Puts that have 30
days or fewer before their expiration to minimize my risk exposure; (3)
finally, I expect at least a 10% annualized return though often I get much
more than that. Quality underlying stocks, risk control and a good return
on my pile of money.
__________________________________________________________
Click to get the Poweropt set of Puts for the TSM screen.
So how do I find the specific Puts that I’m looking for? Good question.
I use a powerful option screen. First, I provide it a listing of all the
TSM stocks for the week and the expiration month that I’m interested in,
always what’s called the front month. In real time, it then gathers data on
all the available Puts for these stocks and rank orders them by their risk
control measure, something that I call % downside protection and the screen
calls % break even. Expressed as a percentage of price loss, it tells me
exactly how much the underlying stock for a particular Put can fall before I
experience any loss.
Here’s an example of the screen that I ran end of day on 5/30/14. Let’s
spend a little time talking about the various columns of information, what
they mean and which ones I consider important. Note, I provide this screen
every evening in the TSM daily report, and I email specific Put plays that
I’ve just made during the day.
-the
first two columns identify the underlying TSM stock involved and its end
of day price with change from the prior day; SYNA was the top stock on
the list Friday.
-the
third column identifies a particular Put for SYNA (one of many that it
has), specifically its $60 Put expiring on the third Saturday in June,
that’s in 22 days from now; note, selling this Put (called writing this
Put in the option world) would obligate me to buy SYNA shares (100
shares per option contract) at $60 a share anytime the seller wished to
sell them to me over the next 22 days; and why would the owner of the
Put contract want to sell his shares to me? One reason, his shares have
fallen below $60 during that time. We protect ourselves from that
situation by dealing exclusively with TSM stocks characterized by strong
fundamentals and by limiting our exposure to 22 days, but even so, about
5% of the time, this will happen, and we’ll get shares put to us that
we’ll have to deal with in our stop loss strategy, but that’s a subject
for another video.
-the
next two columns show this Put’s option premium spread and its bid
price: the first is a measure of the Put’s liquidity (I limit the
screen to finding Puts where this spread is 25 cents or less), and the
second is the minimum premium that I could expect to take in when this
screen was run (I always try to get the mid price between the bid and
ask values; here the ask price would be the 50 cents plus the 15 cent
spread);
-the
next six columns deal with this Put’s specifics:
Delta
tells me how much the premium will change when the underlying stock goes
up $1, e.g., if SYNA goes up $1 on Monday, I could expect its 50 cent
premium to drop by 11 cents; Delta is also the approximate probability
that SYNA shares will finish below $60 over the next 22 days (an
approximate 11% chance here); the exact probability calculated from a
number of factors that I won’t go into here is a 87.8% chance that SYNA
shares will finish above $60, and I will just keep the premium; I prefer
delta to fall below 0.15; note too, that these probability estimates do
not consider technical factors, e.g., where areas of support and
resistance might lie. Technical factors, I believe, are the reason that
less than 5% of these get put
to me, even when the delta would predict more than that.
Implied volatility
is an annualized measure of SYNA’s future price variation expected by the
option market maker; it’s directly related to the Put’s premium, i.e., the
greater the volatility, the greater the premium; for me, the important
thing is how this future volatility relates to SYNA’s past historical
volatility; the next to last column (IV/HV)
shows that ratio, e.g., here at 0.95, the future volatility is expected to
be slightly less than its historic volatility over the past 50 days; Note,
I would prefer this ratio to be well above 1.0 because that indicates the
Put’s premium is rich relative to its historic volatility; note too, in
periods of rising stock prices like we’re now experiencing in the market,
the implied volatility for Puts, hence their premiums, lessen.
The
% implied volatility range
shows how the current volatility relates to the range of volatility this
option has seen over its life; here, it’s at the 18% level; its volatility
has been higher 82% of the time; obviously, we would prefer this number to
be greater than 50% because that would indicate again the option was rich in
premium; further, if it were greater than 50%, you might expect the law of
reversion to mean would favor the implied volatility dropping, hence its
premium dropping, and that’s always a good thing when you’ve sold the
option. If this 50 cent premium drops to 5 cents, I would be inclined to
buy back the Put, close the position, and look to open another position that
month with richer premium.
The
current option volume
is the number of this option’s contracts that have been traded today, and
the
open interest
is the total number of this option’s contracts that are currently open, not
necessarily traded today but open; both are measures of the option’s
liquidity;
While we’re talking about option characteristics, let’s talk about
Theta,
the last column; it’s the change expected in the option premium due to the
passage of one day’s time; remember options are wasting assets which lose
their value every day, even if nothing else changes; e.g., with SYNA, I can
expect its 50 cent premium to drop by 2 x 3.15 cents by Monday morning when
two days will have passed.
There’s an
Earnings Date
provided with the number of days before that date is reached in parenthesis
because that day is likely to move the underlying stock price and option
premium so you need to be aware if it’s coming up in the next 22 days;
often I will write a Put intentionally to include an earnings report because
the approach of an earnings’ release typically inflates an option’s premium,
but when I do, I always insist on good downside protection;
The final three factors are the most important to me, show stoppers if
you will:
two yield measures
and a
% break even
(or what I call % downside protection). The % Naked Yield is the return I
would receive over the 22 days, considering the premium relative to the
amount of money that would be set aside in my account until this option
contract was resolved; it’s assumed that you will have to set aside the
strike price times the number of shares involved (100 shares per contract);
for example, if I sold 1 contract of SYNA Puts, I would have to set aside
100 x $60 per share –50 cents per share premium or $5,950. The return would
then be $50 / $5,950 = 0.84% (a little different than the 0.8% stated in the
table because they do not correct the $6,000 set aside for the option
premium received. These estimates are what you would be required for an IRA
account; a typical equity account would require less money be set aside in
your account, hence
give an even better return. The
annual return
is simply the return you could expect if you made this same investment every
22 days for a year.
Finally,
the % break even
is simply the percentage that SYNA’s price must fall before I, as the Put
seller, would start losing money; along with the chart characteristics,
yield and delta, this percentage is the most important factor to me; it’s
the basis for which all these options are ranked.
Having said all this about SYNA, the Put that I chose to write was the
second one on the list, EMES, because I liked its fundamentals and chart
better.
__________________________________________________________________________________________________________
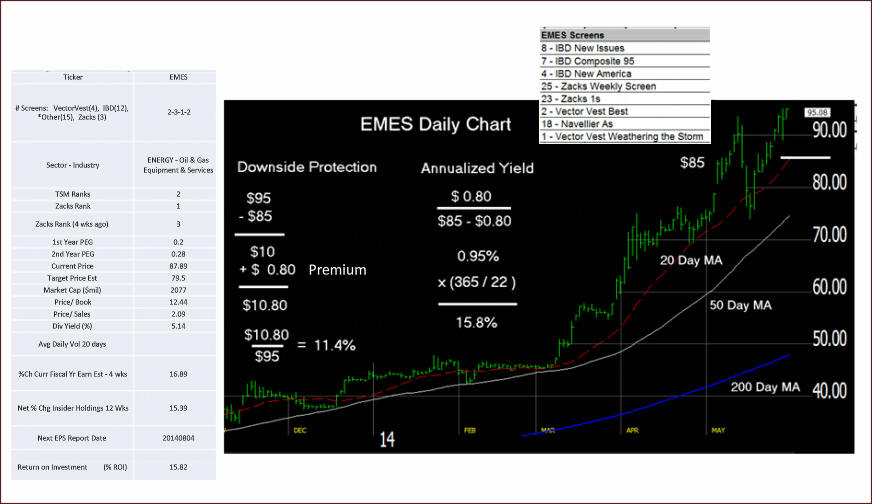
EMES Fundamentals
After running the option screen, I look at the fundamentals of the stocks
that I’m considering. Note, each evening I also provide this fundamental
data for all the Puts under consideration.
EMES fundamentals are shown here.
It holds membership this week in 8 of my screens: the set of four
numbers separated by dashes tells me that 2 of the screens are Vector Vest,
3 are IBD, 1 is from a variety of other sources (here Navellier) and
finally, 2 are from Zacks. The particular screens are listed.
TSM ranks each of its stocks on a 1 to 6 scale, the higher the better
(particular criteria can be found at the TSM site); Zacks ranks stocks on a
1 to 5 with the lower numbers the better; Zacks rankings are proprietary,
based on a number of earnings criteria; they are simply the best ranking of
stocks available.
The target price is based on earnings valuation methodology. Of
course, I would prefer my Put’s strike price to be lower than this target
price, because ultimately, I could be owning the stock at that price.
PEG ratios (Price to Earnings to Earnings Growth ratios or another way
of looking at it Price divided by (Earnings x Earnings Growth)) are measures
of value, and the lower their value the better the value at the stock’s
present price. I use two PEG ratios; the first is based on this year’s
earnings growth and the second based on the following year’s estimate.
For me, the important fundamentals in their order of importance:
Zacks Rank (can be a 3 if Market Cap > $10 billion) – PEG ratios – Target
Price Relative to Strike Price – Price/Sales – Which source have them ranked
in their Screens
_____________________________________________________________________________________
EMES Chart
Let’s now spend a few minutes looking at EMES’ chart.
I like the fact that it has been steadily moving higher with good
support from its 20-day and 50-day moving averages.
I wrote the $85 Put, shown by the white line on the chart for an 80
cent per share premium and guaranteed that over the next 22 days I would buy
100 shares per contact for $85 a piece. Note, the 20-day moving average
support right there.
The % Downside protection is calculated as the difference between the
current price and the Put’s strike price + the per share premium. Here, the
current price is $95; the strike price is $85, and the premium is 80 cents.
EMES shares would have to fall by $10.80 over the next 22 days before I
would start to lose money. That’s 11.4% relative to the current price.
The yield is again a simple calculation. Here, its 15.8% annualized.
|
|