TripleScreenMethod.com
Current Monthly Trading Article
(appeared in December '04 issue of CANSLIM.net News)
The Decennial Cycle: Dow at 40,000 by 2009 by Richard W. Miller, Ph.D.
Harry S. Dent, Jr. argues in "The Next Great Bubble Boom" that the Dow will top 40,000 by 2009. His prediction follows from three independent factors: (1) demographic arguments, i.e., the spending/savings characteristics of the “baby boomer” generation, (2) the maturation of growth cycles in our change-wave technologies like the internet and broadband, and (3) the favorable tendencies of the recurring 10-year or “decennial” market cycle. Dent puts it this way, "There will be another great bull market into the end of this decade that is likely to be even stronger than the 1990s bull market." We should listen because of his impressive forecasting in the ‘80s and ‘90s when people thought he was a bit crazy. Find a review of Dent’s new book By Terry Savage of the Chicago Sun-Times here.
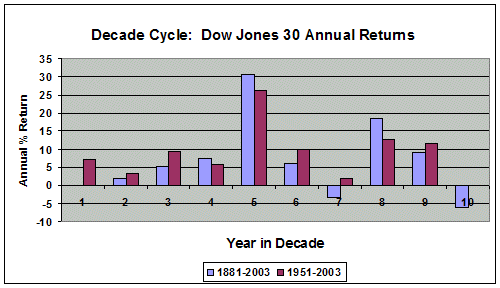
I’ve written before about the statistical significance of two important market cycles, the six-month and the four-year Presidential cycles (CANSLIM.net News, 11/03). Here, I want to consider the decennial cycle because of the ramifications for next year, the fifth year of the decade. Since the 1880’s, each decade’s fifth year has produced a positive return (12 of 12 times, averaging +30.7% for the Dow). Other authors have recently written about the importance of this cycle: Yale and Jeffrey A. Hirsch in "Stock Trader’s Almanac 2005" and Larry Williams in "The Right Stock at the Right Time."
The importance of this cycle is evident by the following: from 1900 through 2002, if one were out of the market at the beginning of the “0” year, entered the S&P 500 on 6/30 of the “2” year, then were out from August through October of the “7” year, and finally re-entered until the end of the “9” year, the value of $1 invested in 1900 would be worth $6,660.86 in 2002 versus just $148.41 were you instead fully invested over the entire period of time. An awareness of the 10-year cycle would have produced 44.9 times the return. It occurs because the advances and economic booms in the latter half of most decades tend to be followed by consolidations of these gains in the early years of the next decade, which are sometimes referred to as the “Decade Hangover Cycle.”
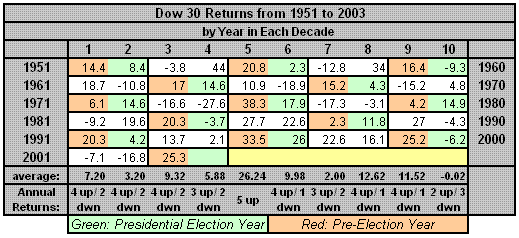
The accompanying bar chart shows the average Dow 30 returns by year within the decade for 1880 through 2003 and for a more modern 1950 through 2003. Clearly, year “5” has outperformed, while year’s “8” and “9” have also been quite positive. On the other hand, year’s “7” and “10” have underperformed. The table provides return data for the shorter period and additionally shows where each year lies with regard to the Presidential cycle. Remember, the pre-election and election years outperform the other two in this 4-year cycle.


Clearly, year “5” of the decade outperforms. Over these five decades, the fifth year has averaged a 26.24% return, and years “8” and “9” nearly half that. Further, this decennial cycle seems to be impacted, though not controlled, by the Presidential cycle. That is, the fifth year had three bullish pre-election years but so did years “1” and “9.” In any event, 2005 looks promising. As a statistician, my first question is whether this fifth year tendency is statistically significant.
I approached the problem with a statistical technique called “Resampling.” Essentially, one assumes there is no preference and any of the annual returns in a decade might have occurred in any particular year. After randomly shuffling the annual returns within each decade, one recalculates the average return by year from 1951 through 2003 and then compares the maximum return (whatever the year) to 26.24%. One wants to assess whether the latter is truly a rare event. Following this approach 100,000 times indeed shows that 26.24% or better occurs only 3.1% of the time. Therefore, the real “5” year out performance is a true statistically significant event and is indeed special.